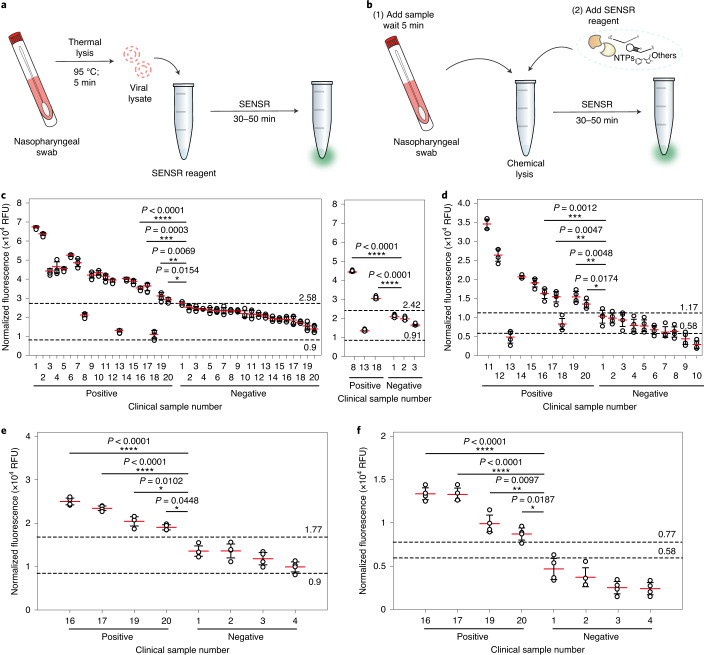
Fig. 8. SARS-CoV-2 detection from clinical samples by SENSR.
a,b, Schematics of SARS-CoV-2 detection from clinical samples by SENSR. Clinical samples in UTM were treated by either thermal (a, c and e) or chemical lysis (b, d and f) and mixed directly with the SENSR mixture. c,d, SARS-CoV-2 detection from clinical samples. A total of 40 samples (20 positives and 20 negatives; confirmed by rRT–PCR) were tested with the thermal lysis SENSR workflow (c, left). Another probe set (SARS-CoV-2-BR3) predicted two additional positives out of three that were incorrectly predicted as negatives by the thermal lysis SENSR workflow (c, right). Among the samples, a total of 20 (ten positives and ten negatives) were tested using the chemical lysis SENSR workflow (d). Positive samples were numbered according to their Ct values, sorted from lowest to highest (Supplementary Table 6). Negative samples were numbered according to SENSR fluorescence intensity, sorted from highest to lowest. The dashed lines indicate fluorescence intensities from SENSR reactions with reference samples containing one copy of synthetic target RNA (top) or no target RNA (bottom). SENSR reactions were run for 50 min. e,f, Detection of SARS-CoV-2 by 30-min SENSR reaction. Four positive samples with the highest Ct values (the lowest target RNA concentrations) and four negative samples with the highest fluorescence values from 50-min SENSR reactions were tested to validate the feasibility of SENSR to detect SARS-CoV-2 from clinical samples in 30 min. The dashed lines are as in c and d. The clinical and reference sample tests were performed with four biological replicates (two-tailed Student’s t-test for comparison between the results from clinical samples and the results from reference samples with one copy of synthetic target RNA; *P < 0.05, **P < 0.01; ***P < 0.001; ****P < 0.0001; horizontal lines represent means ± s.d).

