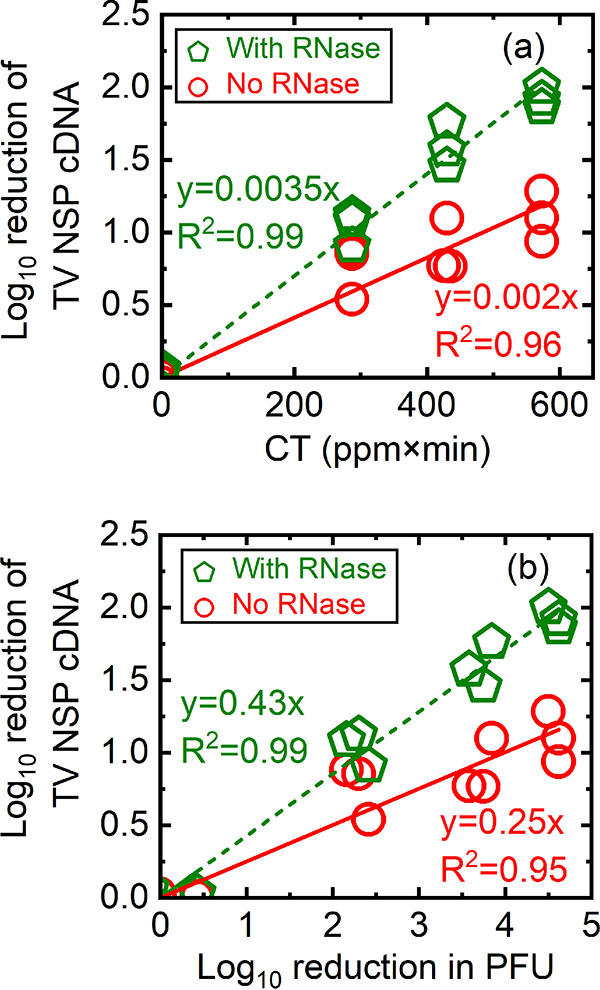
FIG 3.

Log10 reduction of TV NSP cDNA quantified from RNA extracted from PGM-MB-bound viruses that were either untreated or treated with PAA only, or untreated/treated with PAA followed by RNase. The log10 reduction of TV NSP cDNA was calculated as log10 N0/N (or −log10 N/N0) in which N0 is the copy number of untreated TV, and N is the copy number of TV post-PAA exposure and was plotted as a function of CT (a) or as a function of log10 reduction in PFU (b). Green pentagons, untreated TV and PAA-treated TV samples treated with RNase prior to PGM-MB binding assays; red circles, untreated TV and PAA-treated TV samples not treated with RNase and directly exposed to PGM-MBs. All data from three separate experiments are plotted.
