
Figure 2.
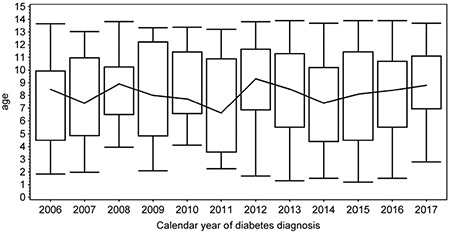
Box plot of mean age at the time of type 1 diabetes diagnosis in sequencially analyzed calendar years. The upper and lower box boundaries indicate quartiles and the line across the centre of the graph joins the medians. The whiskers indicate the range of age in each year