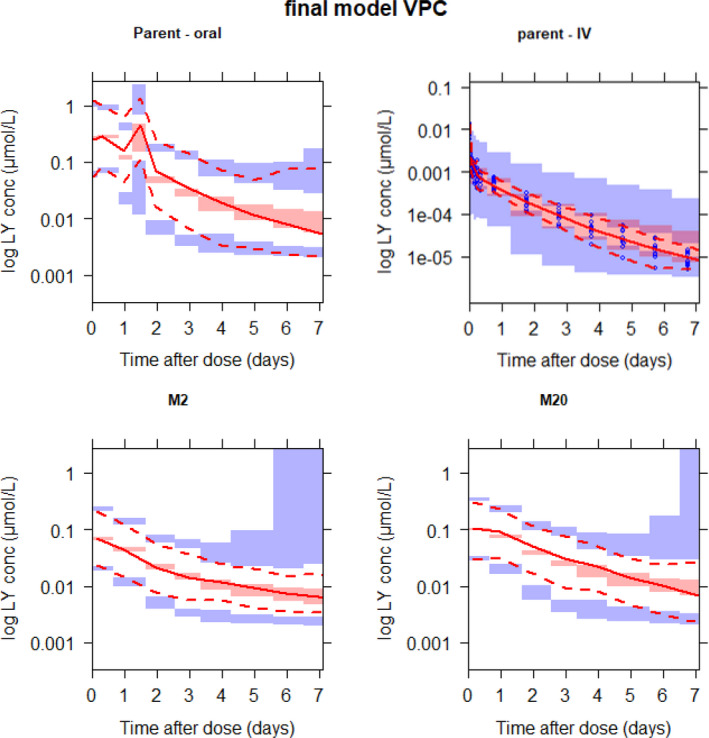
Figure 2.

Prediction‐corrected visual predictive checks (VPC) up to 1 week after the dose for the final model. The images below demonstrate a simulated mechanistic population pharmacokinetic model predicting concentrations of abemaciclib (top) and its active metabolites M2 (bottom left) and M20 (bottom right). Intravenous (IV) data are only included for abemaciclib (top right). The blue dots (top right) are observations (shown only for intravenous data because they were too dense for the other panels and overshadowed the plot). The solid red line in each panel depicts median observed data, and the pink shaded areas define 95% confidence intervals around the median of simulated data. The dashed lines represent the observed 5th and 95th percentiles, and the blue shaded areas represent simulated 95% confidence intervals of the same. conc, concentration.
