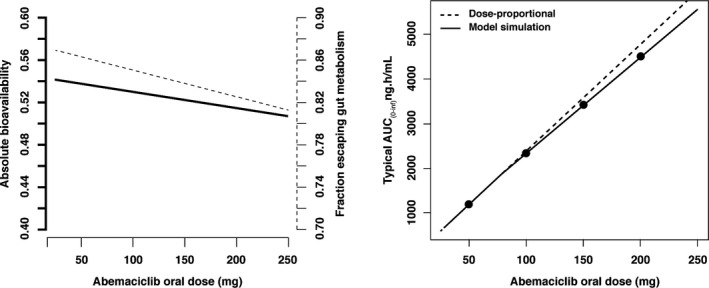
Figure 3.

Impact of administered abemaciclib dose on bioavailability and exposure. The left panel shows the relationship between absolute bioavailability (solid line, left‐hand axis) and dose and also fraction escaping gut metabolism (dashed line, right hand axis) and dose. The right panel shows the relationship between AUC0−∞ and dose under the model simulation (solid line) and the assumption of dose proportionality (dashed line). AUC0−∞, area under the curve from 0 to infinity.
