Figure 3.
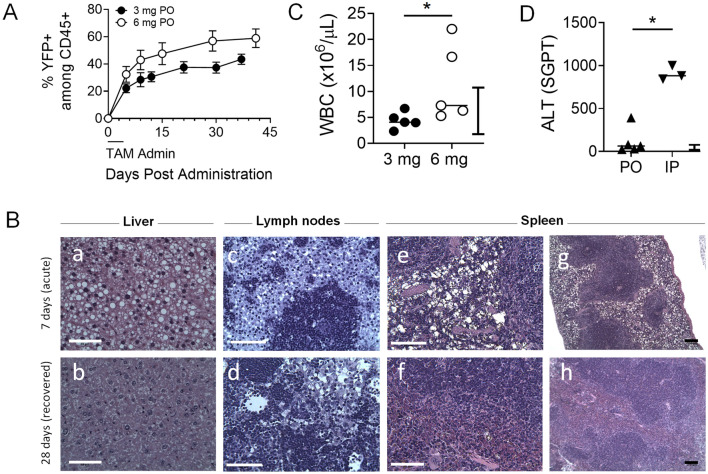
Treating mice with high dose of TAM increases YFP induction among CD45+ cells but also results in liver injury. (A) Frequency of YFP-expressing CD45+ cells after PO administration of TAM at 3 or 6 mg. (B) Histopathology analysis on fixed liver (a,b), lymph nodes (c,d) and spleen (e–h). The upper row reveals apparent macrophage lipidosis during acute phase (on day 7 after 5 IP treatments with 3 mg TAM). The lower row shows no macrophage lipidosis present in any tissues on day 28 in mice that fully recovered. White scale bars (a–f) indicate 50 μm and black scale bars (g,h) indicate 100 μm. (C) White blood cell (WBC) count and (D) Alanine aminotransferase (ALT) test measuring serum glutamic-pyruvic transaminase (SGPT) from mice treated with 3 mg or 6 mg TAM PO and IP. Data are presented as mean ± SEM (n = 3–5 mice or pools of mice/group). Bars indicate normal reference range for WBC and ALT in mice, provided by manufacturer and based on calibration. Man-Whitney test for used for unpaired sample comparisons. *p ≤ 0.05.

