
Figure 4.
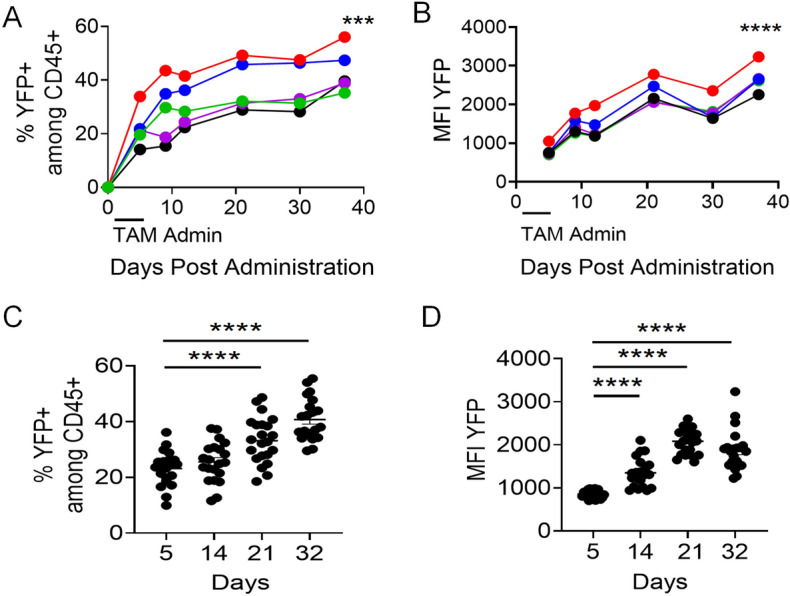
Optimized dosage and route of TAM administration induces gradual increase in YFP expression over time. (A) Frequency and (B) MFI of YFP expression within peripheral blood CD45+ cells analyzed at different time points (n = 5). Different colors represent individual mice. Validation with another larger cohort of mice (n = 21) showing (C) frequency (Day 5—23.2 ± 6.1%, Day 14—25.2 ± 7.2%, Day 21—32.9 ± 8%, Day 32—40.7 ± 7.6%) and (D) MFI of YFP expression (Day 5—855.9 ± 89.7, Day 14—1,354.5 ± 337.3, Day 21—2,104.7 ± 275.6, Day 32—1875.9 ± 474.3) within peripheral blood CD45 + cells at different time points after the beginning of treatment. YFP MFI was measured on YFP+ cells. In both cohorts, mice were treated for 5 consecutive days with 3 mg of TAM administered PO. Mixed model ANOVA test with repetitive measures was performed to identify significant differences following 3 mg TAM treatment PO (A,B). Data are presented as mean ± SEM. Non-Paired T test for used for unpaired sample comparisons (C,D). ***p ≤ 0.001, ****p ≤ 0.0001.