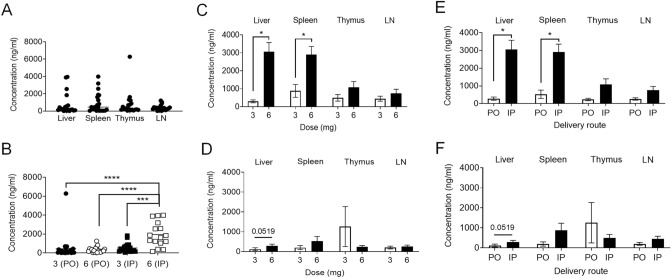
Figure 5.
Concentration of TAM measured in tissues. IP injection of TAM results in greater TAM concentration in tissues than PO administration. Comparison of TAM concentration between different tissues regardless the dose and delivery route of TAM (A; n = 21/group), and when given IP versus PO 3 mg and 6 mg dose from pooled tissues (B; n = 21/group). Comparison of TAM concentration given by IP (C) and PO (D) route (n = 4–5/group). Comparison of tissue TAM concentration between IP injection and PO when give TAM with high dose—6 mg (E) and low dose—3 mg (F) (n = 4–5/group). Data are presented as mean ± SEM. Mann–Whitney test was used for unpaired sample comparisons. *p ≤ 0.05, ***p ≤ 0.001, ****p ≤ 0.0001.

