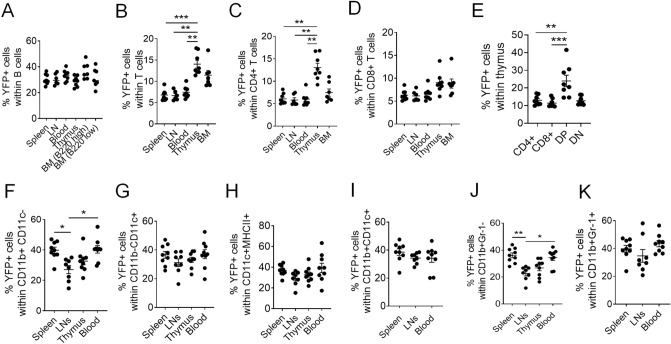
Figure 6.
Highest induction of Cre in myeloid cells, and among T cells, in DP thymocytes. Frequency of YFP expressing cells (%) in (A) B cells (B220+ CD3−), (B) T cells (B220− CD3+), (C) CD4+ T cells (B220− CD3+ CD4+ CD8−), (D) CD8+ T cells (B220− CD3+ CD4− CD8+), (E) single positive CD4+ /CD8+, double positive (DP) and double negative (DN) thymocytes, (F) CD11b+ CD11c− macrophages, (G) CD11b− CD11c+, (H) CD11c+ MHCII+ and (I) CD11c+ CD11b+ dendritic cell populations, (J) CD11b+ Gr-1− and (K) CD11b+ Gr-1+ cells. Data was collected from 8 mice (CAG-Cre+) treated with TAM 3 mg PO. See Suppl. Information Fig. S2 for cell gating strategy, including BM B220 high and low cell gating. Data are presented as mean ± SEM. Mann–Whitney test was used for unpaired sample comparisons. *p ≤ 0.05, **p ≤ 0.01, ***p ≤ 0.001.

