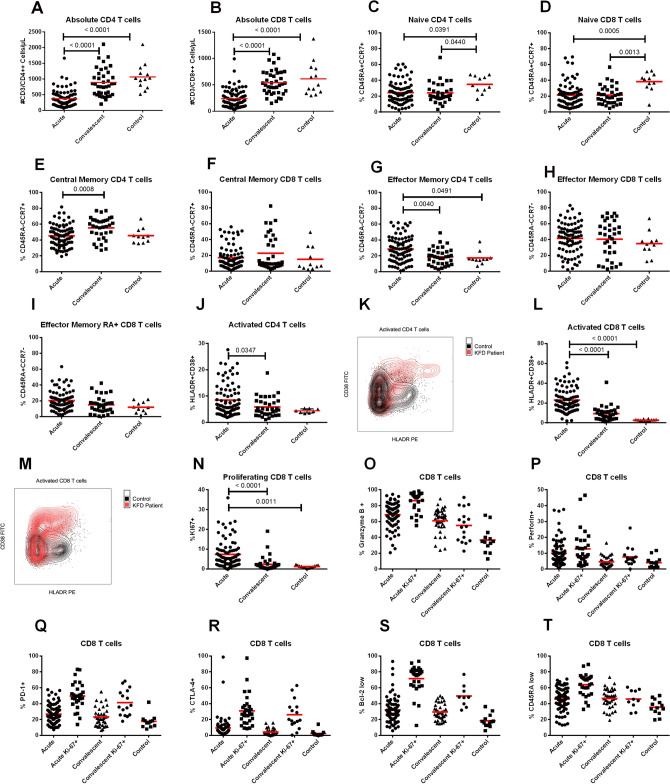
Figure 2.
T cell responses during acute and convalescent KFDV infection. Absolute numbers of CD4 and CD8 T cells (A,B) (line refers to mean). Frequency of naïve, effector, and central memory CD4 and CD8 T cells (C–I). Representative flow plots for activated CD4 (K) and CD8 (M) T cells in infected patients versus a normal healthy control. Frequency of activated CD4 (J) and CD8 T cells (L). Frequency of proliferating CD8 T cells (N). CD8 + T cells and Ki67 + CD8 T cells expressing effector and memory molecules: granzyme B, perforin, PD1, CTLA-4, BCL-2, and CD45RA (O–T). Statistical significance was determined by one-way ANOVA followed by Tukey`s multiple comparisons test. Graphs were made using GraphPad Prism version 6.01.

