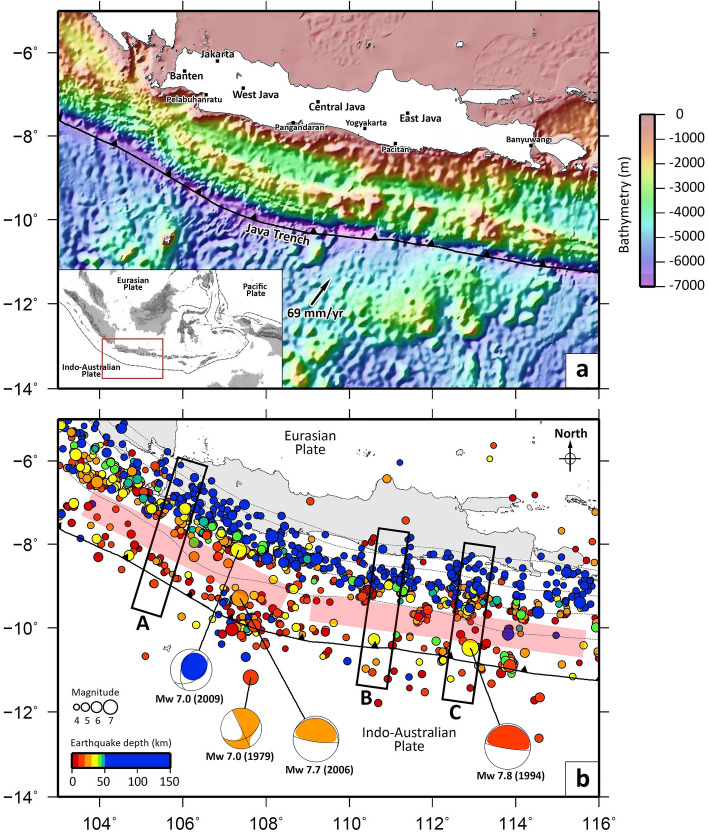
Figure 1.
Regional setting and distribution of epicenters. (a) Map of the study area. Plate motion is from Altamimi et al.5. The bathymetry data were taken from ETOPO16. Inset shows the location of the study area (red rectangle) with respect to southeast Asia. (b) Distribution of epicenters of relocated earthquakes with magnitude ≥ 4.0. The earthquake data (2009–2018) were taken from BMKG. The focal mechanisms of events with M > 7.0 are plotted at ISC-EHB locations and are taken from the Global Centroid Moment Tensor (gCMT) solution catalog (https://www.globalcmt.org); (cf. Supplementary Fig. 2, i.e., all ISC-EHB locations from 1964 to 2016). Note that focal mechanisms are coloured according to gCMT depths, which are not always consistent with the ISC-EHB depths e.g. the 1994 Java earthquake, which is most likely shallow. Regions that lack seismicity (as approximately indicated by the red shaded areas on the map) are interpreted as seismic gaps. Black rectangles (A–C) indicate the location of vertical cross sections shown in Fig. 2. We intentionally compress the colour mapping so that all events below 50 km depth are dark blue such that it is more straight forwards to distinguish upper plate crust events from downdip interface events, and events in the oceanic plate from updip interface events.

