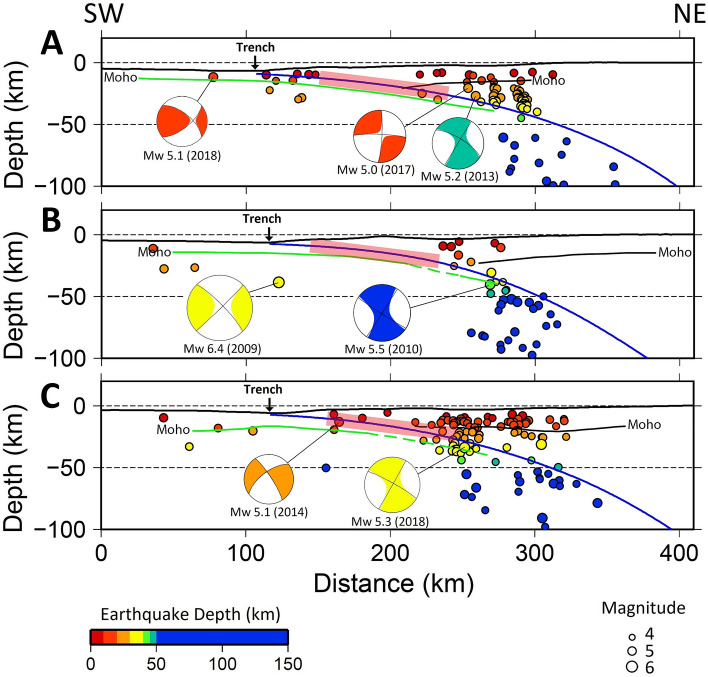
Figure 2.
Cross sections of relocated earthquakes with magnitude ≥ 4.0. The locations of cross sections A–C are shown in Fig. 1b. The focal mechanisms of events were taken from the Global Centroid Moment Tensor solution catalog (https://www.globalcmt.org). Blue lines depict the plate interface of the subducted Indo-Australian Plate according to the Slab2.0 model18, while green and black lines depict the oceanic and continental Moho depths, respectively (taken from58–60). The thick red lines denote the approximate locations of seismic gaps, and are drawn to be consistent with Fig. 1b. Again, we compress the colour mapping so that all events below 50 km are dark blue as in Fig. 1b. Note that focal mechanisms are coloured in the same way as Fig. 1b.

