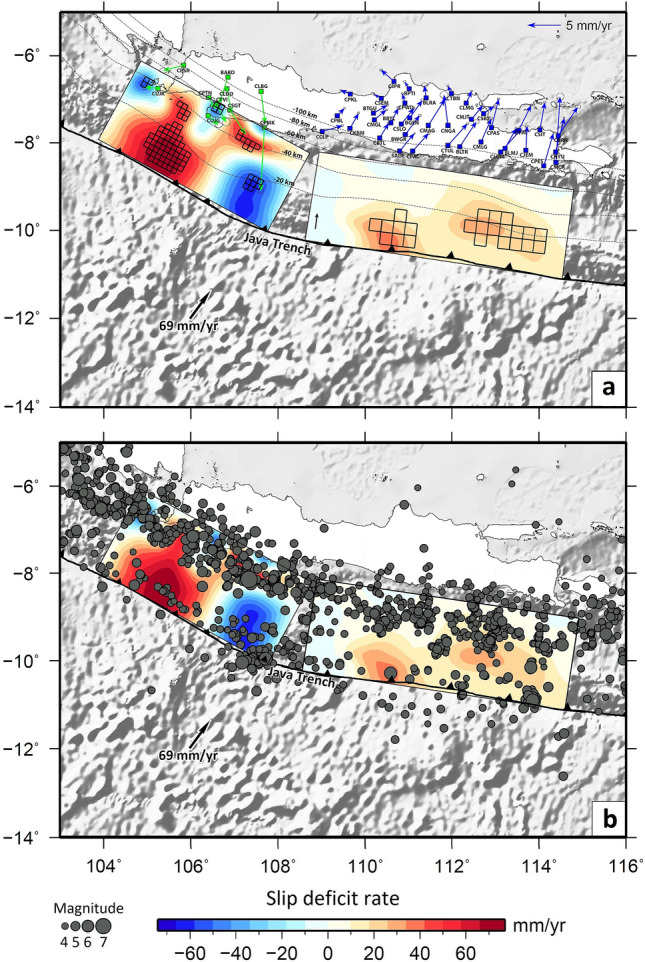
Figure 3.

Interplate coupling models. (a) Slip deficit/excess along the Java Trench derived from GPS data that reflects the segmentation of the megathrust to the south of Java. Left: model derived by Hanifa et al.20; Right: model produced by this study. Black squares are superimposed to indicate where the estimated uncertainty is lower than the absolute value of the predicted slip deficit rate. See Supplementary Fig. 7b for an uncertainty map based on the posterior covariance matrix. Colour scale depicts the estimated slip-deficit rate (red) and the slip-excess rate/afterslip (blue). Dashed lines are contours of the top of the slab from the Slab 2.0 model18. Green squares depict the locations of GPS stations used by Hanifa et al.20 to constrain the model south of West Java, and the blue squares denote the locations of GPS stations used in this study to produce the model south of Central and East Java. Arrows show GPS velocities relative to the Sundaland block reference frame. Blue arrows represent the GPS velocities derived in this study after removing the postseismic deformation of the 2006 Java tsunami earthquake. Green arrows are GPS velocities taken from Hanifa et al.20. Note that most vectors are aligned in the direction of current plate motion. This could be an indication of strong seismic coupling to the south of the study area. The red areas of slip deficit indicate areas with increased potential for a great earthquake. These regions may rupture in individual events or together in the worst-case scenario. Plate motion is taken from the ITRF2014 model by Altamimi et al.5. (b) Same as (a) but with the epicenter distribution shown in Fig. 1b overlaid on the slip deficit model.
