Figure 2.
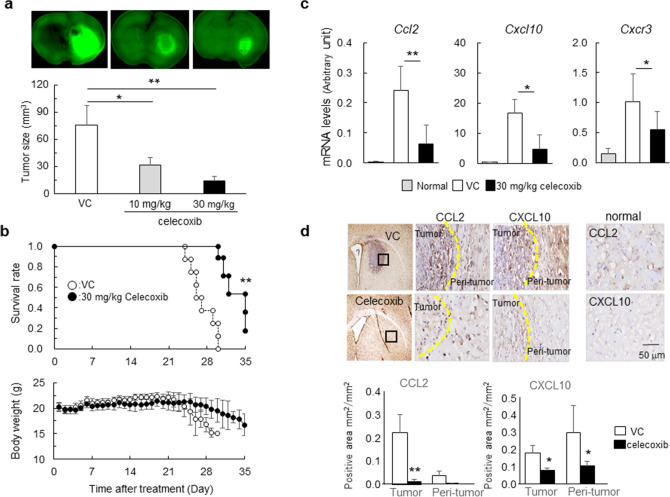
Antitumor effects of celecoxib in the mouse glioma model. (a) GFP+ tumor areas (green) measured in mice treated with 10 mg/kg/day or 30 mg/kg/day celecoxib or vehicle for 7 days (n = 6). *p < 0.05, **p < 0.01 vs. VC by Tukey–Kramer test. (b) Survival curves estimated with the Kaplan–Meier method and changes in body weight for 35 days (n = 8). **p < 0.01 (log-rank test). (c) Ccl2, Cxcl10 and Cxcr3 mRNA levels determined in mice treated with 30 mg/kg/day celecoxib or VC for 7 days and compared with the normal tissue obtained from age-matched C57BL/6 J mice. *p < 0.05, **p < 0.01 vs. normal by Student’s t-test. (n = 6). (d) Representative immunohistochemistry stained with DAB in mice treated with 30 mg/kg/day celecoxib or VC for 7 days. Dashed line, tumor border. The positive areas of CCL2 and CXCL10 in tumor and peri-tumor were analyzed by BZ-X710 microscope equipped analyzing system. Scale bar, 50 µm. Each column data indicates mean ± SD (n = 6). *p < 0.05, **p < 0.01 by student’s t-test.

