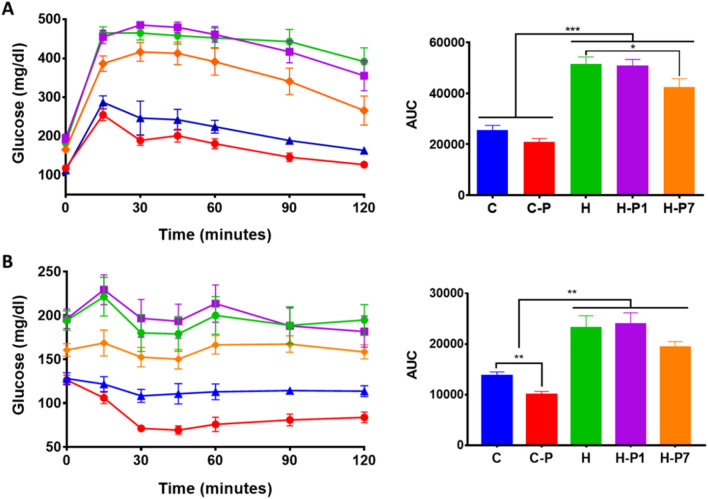
Figure 3.
PSOn treatment reduces glucose intolerance and insulin resistance in HFD-fed mice. The time-course blood glucose levels are plotted for each group after the ipGTT (A) or ipITT (B) as described in the “Materials and methods”. The area under the curve (AUC) was determined and is shown on the right panel for each test. The data are shown as the mean ± SEM. *p < 0.05 by Student’s t test vs. HFD; **p < 0.01 by Student’s t test C vs. C-P; ANOVA **p < 0.01 C and C-P vs. H, H-P1 and H-P7; ANOVA ***p < 0.001 C and C-P vs. H, H-P1 and H-P7.

