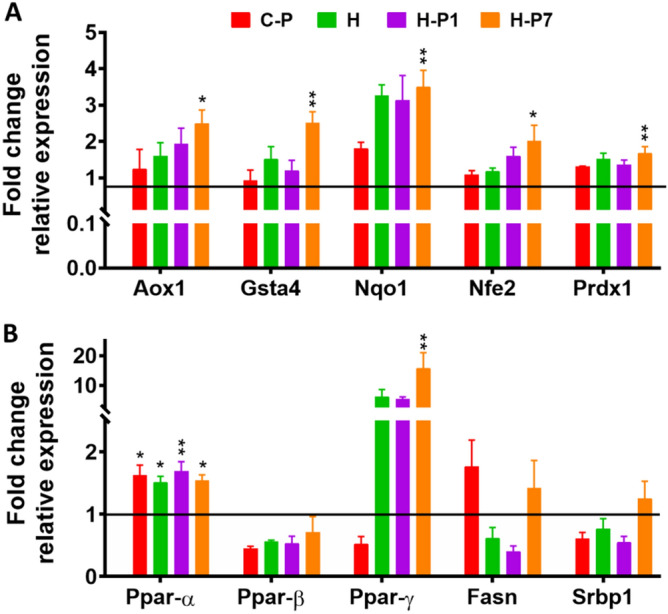
Figure 7.

PSOn increases the antioxidant- and lipid metabolism-related gene expression. Determination of transcripts was made by total RNA extraction from liver tissue and quantitated by qPCR. Representative data are shown. The bars represent the mean ± SEM of the relative expression for each gene and the indicated mouse groups (Aox1, aldehyde oxidase; Gsta4, glutathione S-transferase 4; Nqo1, NADPH-quinone dehydrogenase 1; Nfe2, nuclear factor erythroid 2; Prdx1, peroxiredoxin 1). *p < 0.05; **p < 0.001 vs. HFD group.
