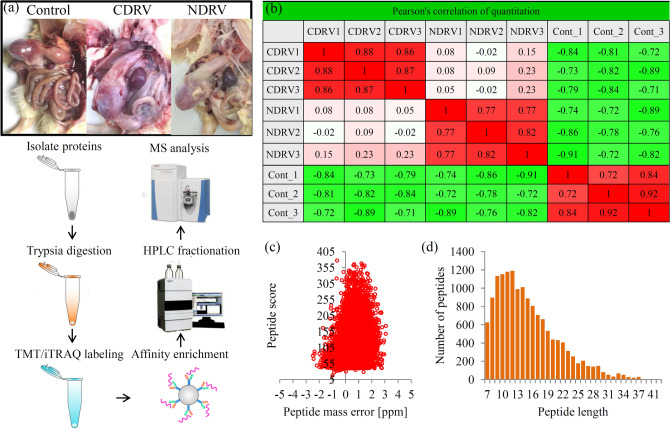
Figure 1.
Overview of the phosphorylation proteomes. (a) The pictures showed the spleen tissues under control and C/NDRV infections. Experimental strategy for the quantitative analysis of phosphorylation proteomes from three different treatment groups. (b) Pearson’s correlation of the phosphorylation proteomes from different sample groups (three biological replicates for each group). (c) Mass delta of all identified peptides. X- axis: Peptide Score; Y-axis: Peptides mass delta. (d) Length distribution of all identified peptides. X-axis: No. of Peptide; Y-axis: Peptide length.

