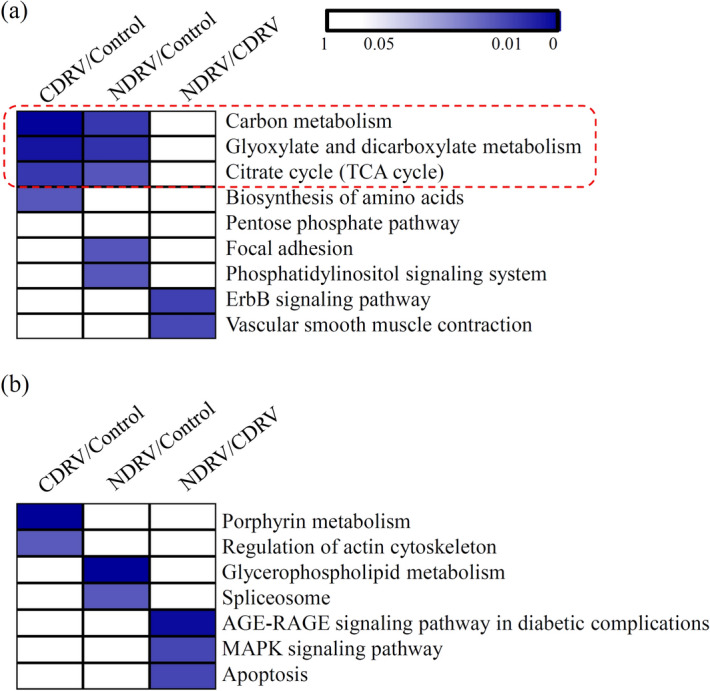
Figure 6.

KEGG enrichment analysis of all phosphorylated proteins. (a) KEGG enrichment analysis of up-regulated phosphorylated proteins in each comparison. (b) KEGG enrichment analysis of down-regulated phosphorylated proteins in each comparison. The significant P values of each KEGG term in the three comparisons were shown by heatmaps. The heatmap scale ranges from 0 to 1. All heatmap were drawn suing R Package pheatmap (v.2.0.3 https://cran.r-project.org/web/packages/cluster/).
