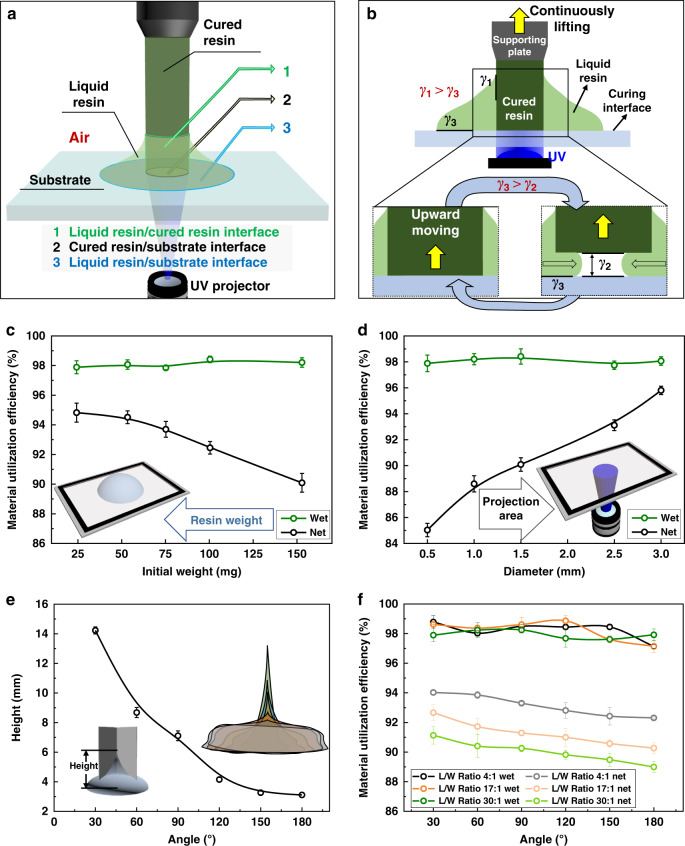
Fig. 3. The influence of droplet weight and UV pattern on the resin utilization efficiency.
a Scheme of the three interfaces involved in the one-droplet 3D printing process, including the interface between the liquid resin and the cured resin (1), the interface between the cured resin and the curing interface (2), and the interface between the liquid resin and the solid resin (3). b Scheme of the two criteria of one-droplet 3D printing process. c The influence of the initial liquid droplet weight on the wet and net material utilization efficiency during the one-droplet printing process. The diameter of the UV pattern is maintained at 1.5 mm, while the initial droplet weight is changed from 24.3 mg to 53.4 mg, 75.2 mg, 100.4 mg and 150.9 mg. Green and black dotted lines represent the wet and net material utilization efficiency, respectively. The error bars in the wet and net material utilization efficiency result from errors in the mass measurements. Each error bar represents the deviation from at least 5 data points. d The influence of the UV pattern area on the wet and net resin utilization efficiency in the one-droplet printing process. The weight of the liquid resin droplet is maintained at ~150 mg under the UV projection of a round shape. The UV pattern diameters are 0.5 mm, 1.0 mm, 1.5 mm, 2.5 mm, and 3.0 mm. The error bars in the wet and net material utilization efficiency result from errors in the mass measurements. Each error bar represents the deviation from at least 5 data points. Green and black dotted lines represent the wet and net material utilization efficiency, respectively. e Rising height of liquid resin on the V-grooved structures versus the intersection angle of the V-grooved structure (L/W ratio of 17:1). The error bars in the rising height result from errors in the height measurements. Each error bar represents the deviation from at least 5 data points. f The influence of the V-grooved angle on the wet and net material utilization efficiency in the one-droplet printing process. Black, orange, and green dotted lines represent the wet material utilization efficiencies of structures with L/W ratios of 4:1, 17:1, and 30:1, respectively. Gray, light orange, and light green dotted lines represent the net material utilization efficiencies of structures with L/W ratios of 4:1, 17:1, and 30:1, respectively. The error bars in the wet and net material utilization efficiency result from errors in the mass measurements. Each error bar represents the deviation from at least 5 data points.

