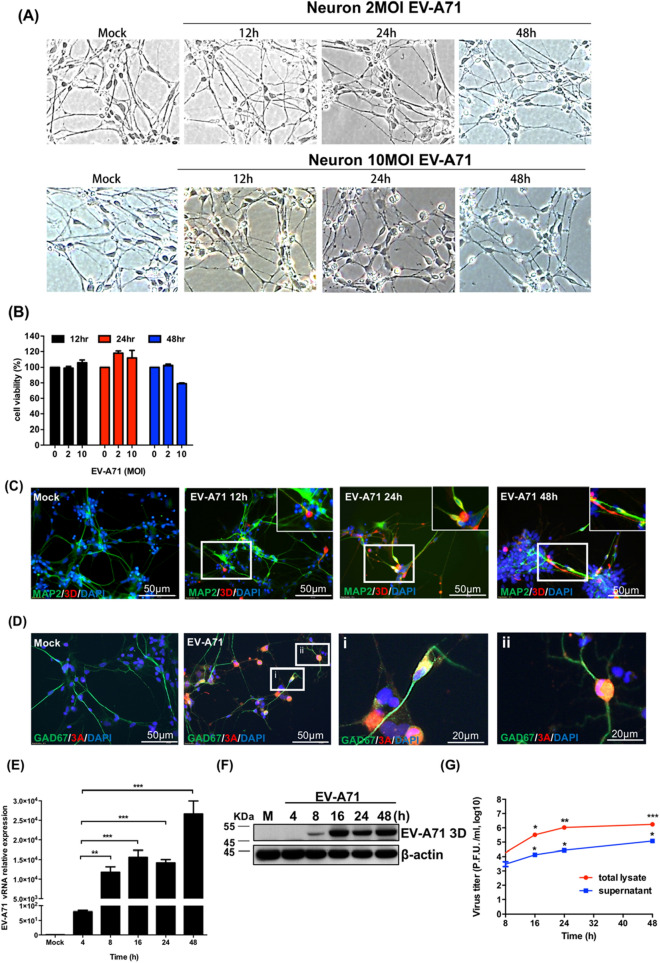
Figure 2.
Neuronal cells are permissive to EV-A71 infection. (A) Neurons differentiated from human NSCs were infected with EV-A71 at MOIs of 2 and 10, and the cellular morphologies were observed with an inverted microscope (magnification = 200 ×). (B) Trypan blue exclusion was performed to quantify the surviving cells at 12, 24 and 48 h postinfection. (C) Neurons were infected with EV-A71 at an MOI of 2 or mock infection. Immunofluorescence images of MAP2 and EV-A71 3D pol in EV-A71-infected neurons at 12, 24 and 48 h postinfection. (D) Immunofluorescence images of GAD67 and EV-A71 3A in EV-A71-infected neurons at 24 h postinfection. Cell nuclei were counterstained with DAPI. The scale bar represents 50 μm. Neurons were infected with EV-A71 at an MOI of 2, and total RNA and protein extraction were harvested at 4, 8, 16, 24 and 48 h postinfection. (E) RT-qPCR assay was performed to detect the relative levels of EV-A71 5′ UTR vRNA, and (F) western blot was used to analyze the expression of EV-A71 3Dpol protein. β-actin was used as an internal control. (G) The total lysates (supernatant + cells) and supernatant were also harvested to detect the virus titer at 8, 16, 24 and 48 h postinfection with plaque assay. The experiments were performed in triplicate, and the error bars represent the SD. Statistical analyses were performed using Student’s t test. *p < 0.05; **p < 0.01; ***p < 0.001.

