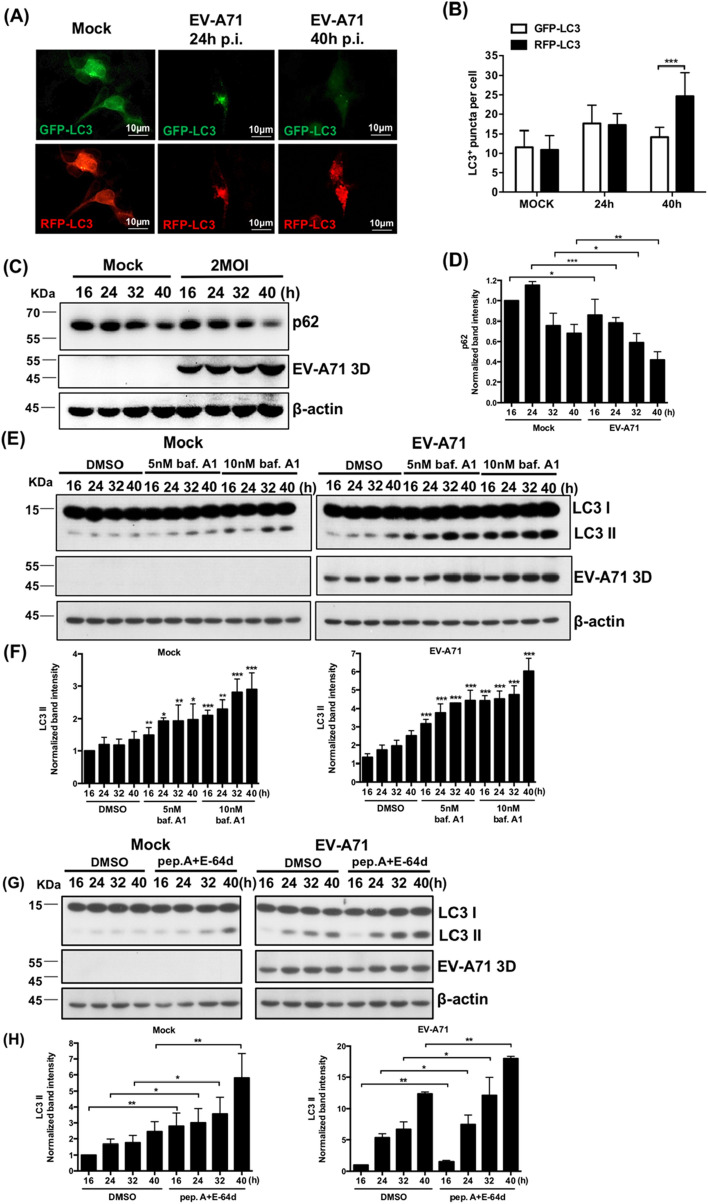
Figure 5.
EV-A71-infected differentiated IMR-32 cells exhibit complete autophagic flux. Differentiated IMR-32 cells were infected with EV-A71 at an MOI of 2. (A) The autophagy tandem sensor RFP-GFP-LC3B was added to EV-A71-infected differentiated IMR-32 cells and observe the expression of GFP-LC3 and RFP-LC3 at 24 and 40 h postinfeciton. The scale bar = 10 μm. (B) The average number of GFP-LC3 puncta and RFP-LC3 puncta was quantified. (C) Western blotting was performed to measure the protein levels of p62 and EV-A71 3Dpol at indicated time points. (D) The band intensities of p62 were measured using ImageJ software and normalized to the β-actin. The time point of mock-infection 16 h was used as a reference. (E) Differentiated IMR-32 cells were treated with 5 or 10 nM bafilomycin A1 or with only DMSO and were infected with EV-A71 (MOI = 2) or underwent mock infection. Western blotting was performed to measure the levels of LC3-I, LC3-II and EV-A71 3Dpol at indicated time points. (F) The band intensities of LC3-II were measured using ImageJ software and normalized to the β-actin. The time point of 16 h was used as a reference. (G) Differentiated IMR-32 cells were cotreated with 10 μM pepstatin A and 10 μM E-64d or only DMSO and infected with EV-A71 (MOI = 2) or mock infection. Western blotting was performed to measure the protein levels of LC3-I, LC3-II and EV-A71 3Dpol at indicated time points. (H) The band intensities of LC3-II were measured using ImageJ software and normalized to the β-actin. β-actin was used as an internal control in all western blots. The error bars represent the SD. Student’s t test. *p < 0.05; **p < 0.01; ***p < 0.001.

