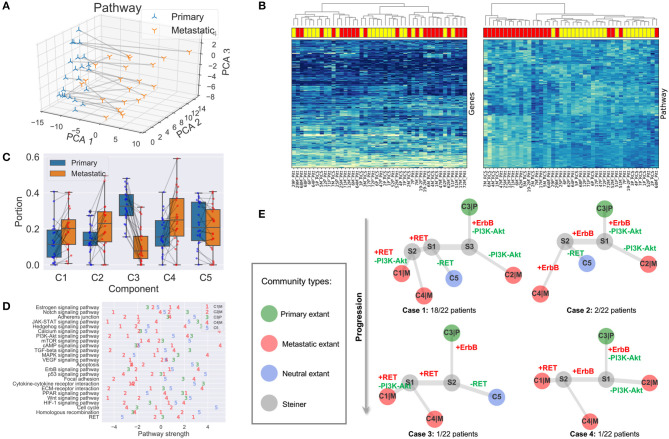
Figure 4.
Results and analysis. (A) First three gene module/pathway representation PCA dimensions of matched primary and metastatic samples. Matched samples are connected. (B) Hierarchical clustering of tumor samples based on raw gene expressions (left panel) and compressed gene module/pathway representation (right panel). Metastatic samples are shown in red rectangles and primary ones in yellow. (C) Portions and changes of the five communities in primary and metastatic sites. Each gray line connects the portions of a community in the primary site (blue node) and metastatic site (red node) from the same patient. (D) Pathway strengths across cell communities. (E) Phylogeny of cell subcommunities.

