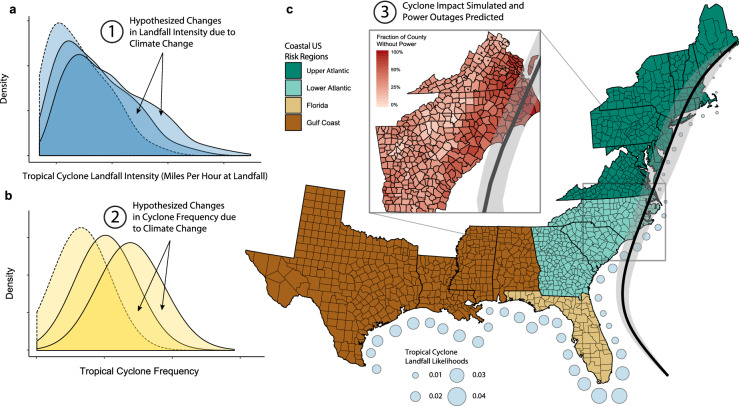
Figure 1.
The schematic of the key sources of uncertainty in hurricane activity (a,b) and a typical outage map (inset) for a given simulated hurricane in the region under study (c). The intensity (a) and frequency (b) of landfalling hurricanes is perturbed from the baseline (dotted line) scenario in line with climate change projections to create future (solid line) scenarios. These scenarios simulate climate-perturbed distributions of tropical cyclone intensity and frequency which are used to simulate storm landfall along the Gulf and Atlantic coasts of the US (c). Note the distributions in (a,b) and the outage map depicted in the inset in (c) do not depict actual values. Plots a-b were created in R (v 3.2.1; https://www.r-project.org/)40 using the ggplot2 (v 3.3.0; https://ggplot2.tidyverse.org/)57. Plot (c) was created in R (v 3.2.1; https://www.r-project.org/)40 using the packages ggplot2 (v 3.3.0; https://ggplot2.tidyverse.org/)57 and usmap (v 0.5.0; https://github.com/pdil/usmap)8. Map shapefiles were from usmap and the US Census Bureau51.

