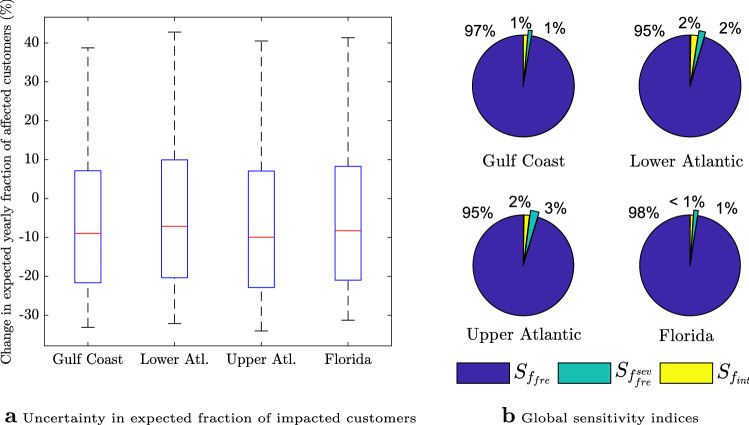
Figure 4.
Uncertainty quantification and sensitivity analysis of the expected yearly fraction of impacted customers under climate change. (a) Box plots of the change (w.r.t baseline scenario) in the expected yearly fraction of affected customers, , for the four US regions. The figure shows the median, the interquartile range, the 5th and 95th percentiles of the change in the expected yearly fraction of customers that experience hurricane-induced power outage, given the uncertainty in the impact of climate change on frequency and intensity of storms, (b) Sobol’ global sensitivity indices characterizing the contribution of factors , and to the variance of the yearly fraction of costumers without power, . The variability in hurricane frequency is the main contributor to the variance of in all four regions under consideration. Plots a-b were created in MATLAB R2016a.

