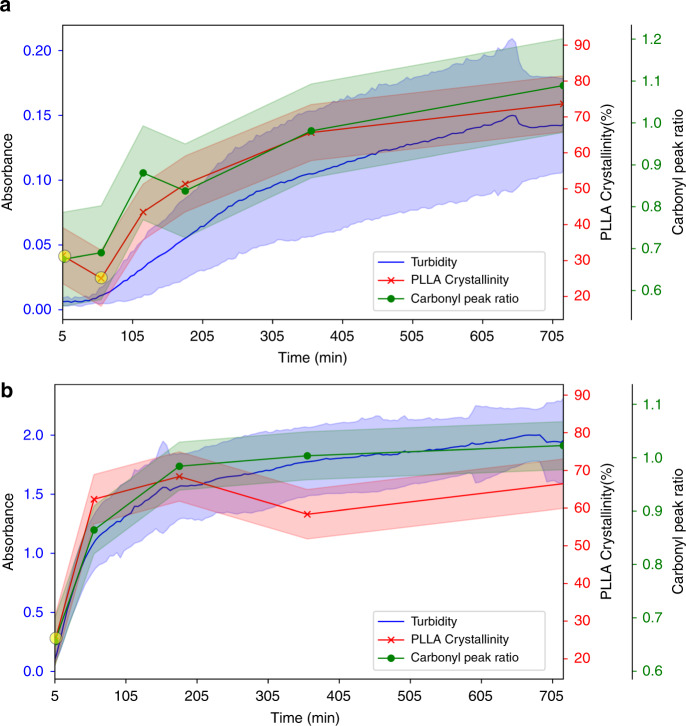
Fig. 6. ROPI-CDSA Kinetics.
Composite graphs showing the change in turbidity (measured at 600 nm), % crystallinity of PLLA block, and carbonyl peak ratio for a PLLA45-b-PEG45 (10% solids w/w 9) and b PLLA90-b-PEG45 (10% solids w/w 15). The standard error of 3 runs is plotted for turbidity measurements and a calculated error is plotted for crystallinity and carbonyl peak ratio values, see Supplementary information for more details. For the PLLA crystallinity (%) data, early time point metastable crystalline precursors are highlighted with a yellow circle. The data show that the self-assembly kinetics are coincident with the crystallinity kinetics.

