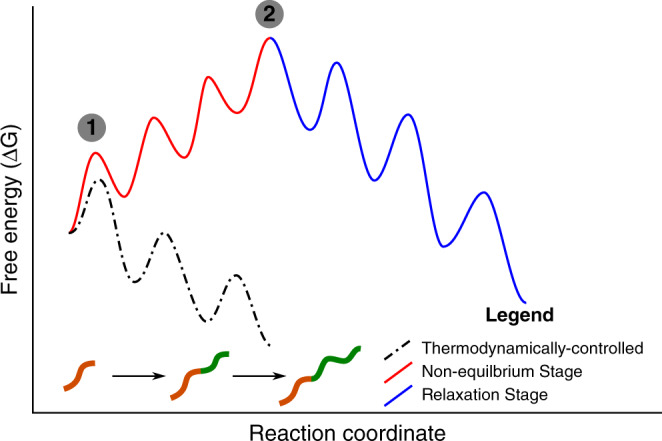
Fig. 9. Free energy diagram for polymerization-induced self-assembly.

The dashed lines represent the situation where the relaxation time is short compared to the polymerization time. Consequently, with each monomer addition, the growing block copolymer relaxes to a lower energy configuration. The result is that the reaction proceeds downhill and finishes when the polymerization terminates. The solid line represents the situation where the polymerization time is much shorter than the relaxation time. Consequently, with each monomer addition, the growing block copolymer cannot fully relax to a lower energy configuration. The result is that the reaction initially proceeds uphill (Stage 1) and then relaxes post polymerization (Stage 2). In Stage 2, the energy barriers represent morphological transitions (e.g., spheres to rods or rods to lamellae).
