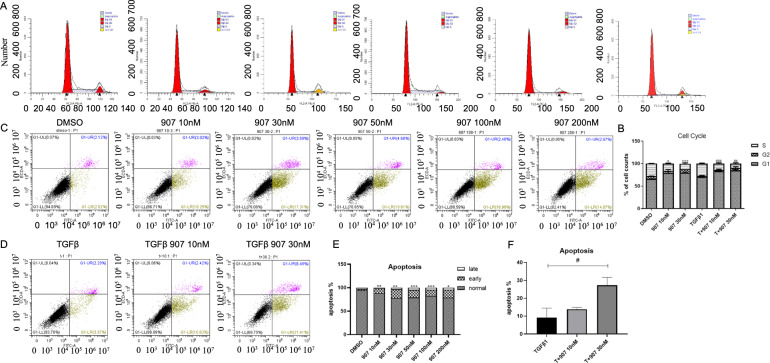
Fig. 2. CUDC-907 treatment causes G1-S arrest and induces apoptosis.
a HLF1 stimulated with or without TGFβ1 were treated with 10 and 30 nM of CUDC-907 for 12 h. Cells were then stained with PI and analyzed by FACS. CUDC-907 caused a significant increase in the G1-S peak in all cell lines tested at the 12-h time-point after drug treatment. b Histogram representation of the percentage of cells in different cell-cycle phases. c HLF1 were treated with CUDC-907 at dose ranging from 10 to 200 nM. Cells were then stained with Annexin V/PI and analyzed by FACS. d HLF1 stimulated with TGFβ1 were treated with 10 and 30 nM of CUDC-907. Cells were then stained with Annexin V/PI and analyzed by FACS. e Histogram representation of the percentage of cells in different apoptosis phases in c. f Histogram representation of the percentage of apoptosis cells in d. Error bars are ±SD. *, **, *** represent 907 treatment groups compared with DMSO group, respectively. *P < 0.05; **P < 0.01; ***P < 0.001. #, ##, ### represent T + 907 treatment groups compared with TGFβ1 group, respectively. #P < 0.05; ##P < 0.01; ###P < 0.001.

