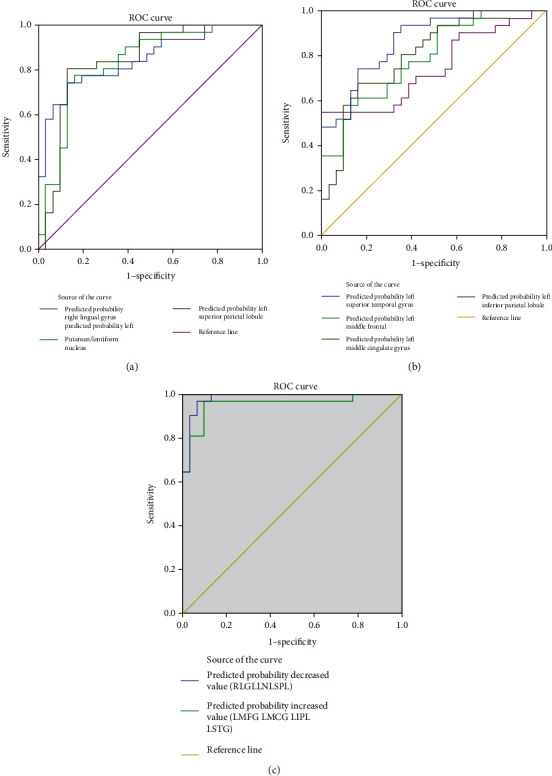
Figure 3.

ROC curve analysis of the different ReHo values for abnormal brain regions in patients with NAION. (a) ROC curve for patient regions with high ReHo. The area under the ROC curve was 0.790 for the left middle frontal gyrus (P < 0.0001; 95%CI = 0.680 − 0.900), 0.797 for left the middle cingulated gyrus (P < 0.0001; 95%CI = 0.685 − 0.909), 0.869 for the left superior temporal gyrus (P < 0.0001, 95%CI = 0.783 − 0.954), and 0.745 for the left inferior parietal lobule (P < 0.001; 95%CI = 0.620 − 0.870). (b) ROC curve for patient regions with low ReHo. The area under the ROC curve was 0.846 for the right lingual gyrus (P < 0.0001; 95%CI = 0.749 − 0.943), 0.843 for the left superior parietal lobule (P < 0.0001; 95%CI = 0.739 − 0.947), and 0.832 for the left putamen/lentiform nucleus (P < 0.0001; 95%CI = 0.728 − 0.937). (c) ROC curve for combined ReHo regions. The area under the ROC curve was 0.983 for the combined regions of low ReHo (see (a) for the regions) (P < 0.0001; 95%CI = 0.958 − 1.009). The area under the ROC curve was 0.954 for the combined regions of high ReHo (see (b) for the regions) (P < 0.0001; 95%CI = 0.899 − 1.009).
