Figure 2.
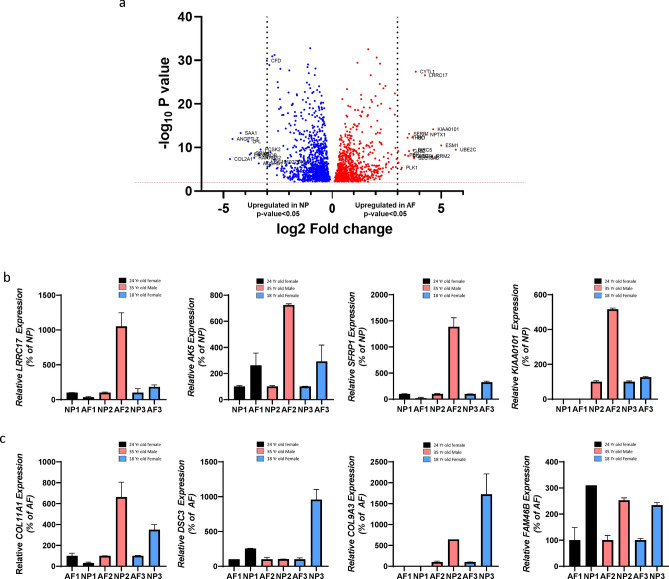
Differential Expression of genes in AF and NP cells. (a) Volcano plot depicting differentially expressed genes in AF and NP cells. Red dots represent genes expressed at higher levels in AF cells while blue dots represent genes with higher expression levelsin NP cells. Y-axis denotes − log10 P values while X-axis shows log2 fold change values. Volcano plot was generated using GraphPad Prism version 8.2.0. (b) Relative gene expression of LRRC17, AK5, SFRP1 and KIAA0101 in AF cells from 3 human samples expressed as a percentage of expression in NP. (c) Relative gene expression of COL11A1, DSC3, COL9A3 and FAM46B genes in NP cells from 3 human samples expressed as a percentage of expression in AF cells. Black, Pink and Blue bars represent gene expression of cells from 24-year-old female, 35-year-old male and 18-year-old female respectively. Bar diagram for gene expression was generated using GraphPad Prism version 8.2.0.

