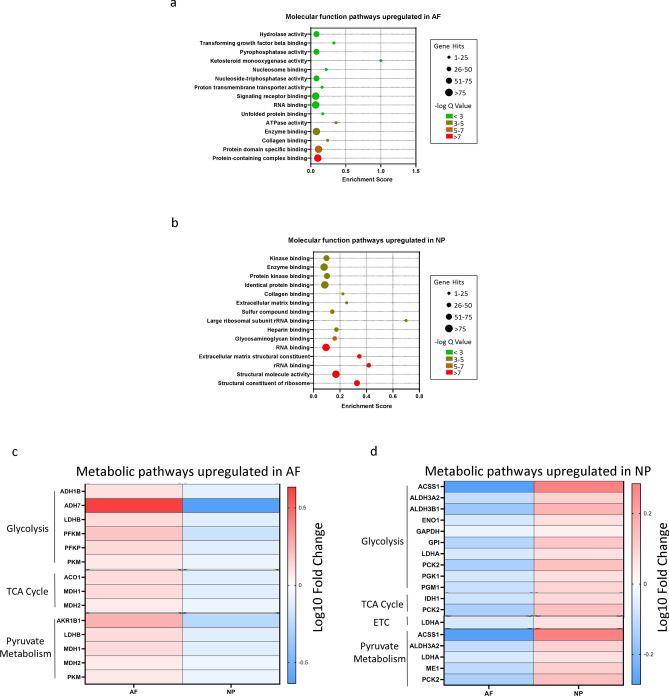
Figure 4.
Gene Ontology analysis reveal compartment-specific enrichment of GO pathways in AF and NP cells. (a) Advanced bubble plot depicting molecular function-related pathways enriched in AF cells. (b) Advanced bubble plot showing molecular function-related pathways enriched in NP cells. Y-axis Labels represent pathway names while and enrichment score is shown on X-axis. The size and color of the bubble represent the number of genes enriched in each pathway and their enrichment significance. The bubble plots were generated using GraphPad Prism version 8.2.0. (c) Metabolic pathway analysis of glycolysis, TCA cycle, electron transport chain and pyruvate metabolism pathways in AF. (d) Metabolic Pathway analysis of glycolysis, TCA cycle, electron transport chain and pyruvate metabolism pathways in NP cells. Heatmap shows log10 transformed fold change in gene expression and were generated using GraphPad Prism version 8.2.0.

