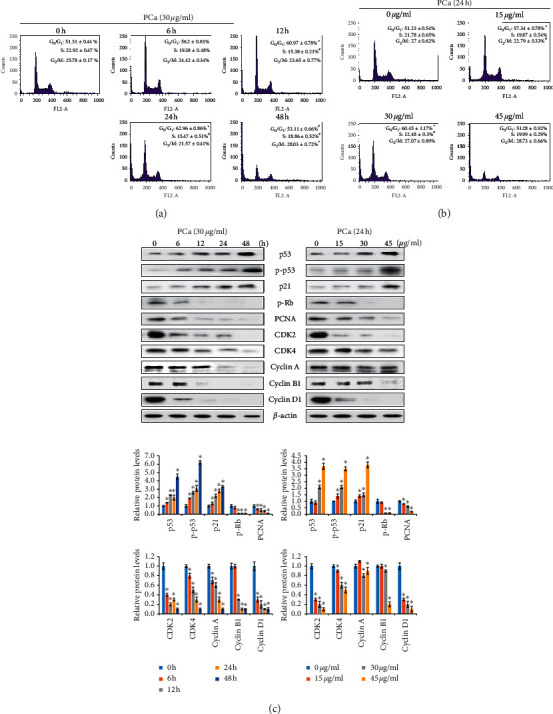
Figure 3.

PCa induced G0/G1 phase cell cycle arrest by decreasing CDK4 and cyclin D1 expression. Cell cycle distribution (G0/G1, S, G2/M phases) of HT-29 cells after treatment with 30 μg/ml PCa for 0–48 h (a); 15, 30, or 45 μg/ml PCa for 24 h (b) was detected and analyzed by flow cytometry and FlowJo software. The results are shown as mean ± SD. ∗P < 0.05 versus control group with a significant increase. #P < 0.05 versus control group with a significant decrease. (c) Western blot showing the upregulation of the proteins p53 and p21, whereas downregulation of the proteins CDK4 and cyclin D1 was observed in HT-29 cells.
