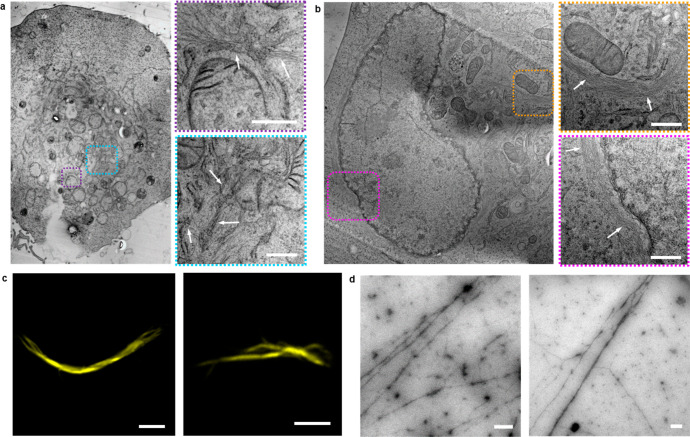
Figure 6.
Intracellular peptide fiber formation. (a and b) TEM micrographs of peptide fibers inside A549 cells (marked with dashed lines) after coassembly of intracellularly generated Fmoc-ISA 3a and C343-ISA 3b and images of a cell, which were received after stitching TEM images together. Scale bars 500 nm. (c) Fluorescence microscopy images of Proteostat-stained peptide fibers after formation inside cells and extraction from the cells by lysis. Scale bars 5 μm. (d) TEM micrographs of peptide fibers, which were received after lysis of depsipeptide TAT complex 13a- and 13b-treated A549 cells. Scale bars 500 nm.

