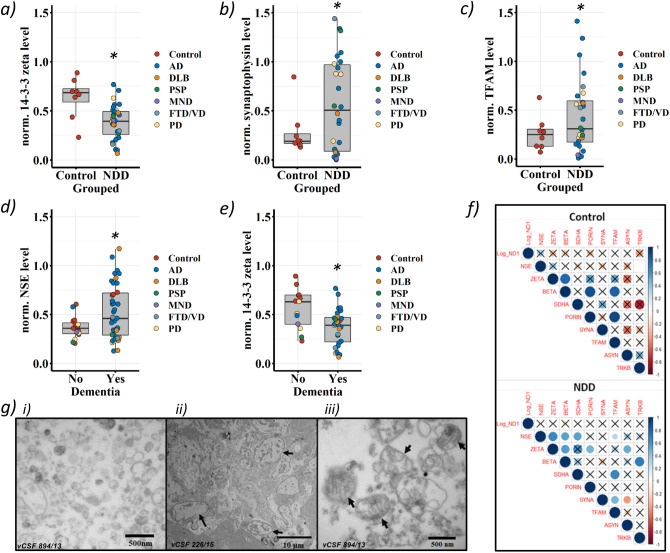
Figure 2.
Comparisons of neurodegenerative protein markers and vCSF-cfmtDNA in NDDs and matched controls. Boxplots of vCSF protein levels, showing, (a) 14–3-3 zeta, (b) synaptophysin and (c) TFAM protein levels in combined NDDs and matched controls. (d) and (e) shows NSE and 14–3-3 zeta protein levels respectively in combined NDDs stratified by the in-life diagnosis of dementia. Boxes show median (thick line), 25th and 75th percentile and whiskers show 95% confidence interval. *indicates significance at p < 0.05 Student’s TTEST. (f) Correlograms of vCSF-cfmtDNA level and protein levels in controls (upper) and combined NDDs (lower). Where, colour intensity depicts r2 and X indicates p > 0.05, Log_ND1 = vCSF-cfmtDNA, NSE = neuron specific enolase, ZETA/BETA = 14–3-3 zeta/beta, SDHA = succinate dehydrogenase, SYNA = synaptophysin, TFAM = transcription factor A, mitochondrial, ASYN = alpha synuclein, TRKB = tropomyosin receptor kinase B. (g) SEM images of vCSF pellets, indicating: (i) vesicular-like structures, (ii) proteinaceous material and (ii-iii) potential mitochondria-like structures (black arrows).

