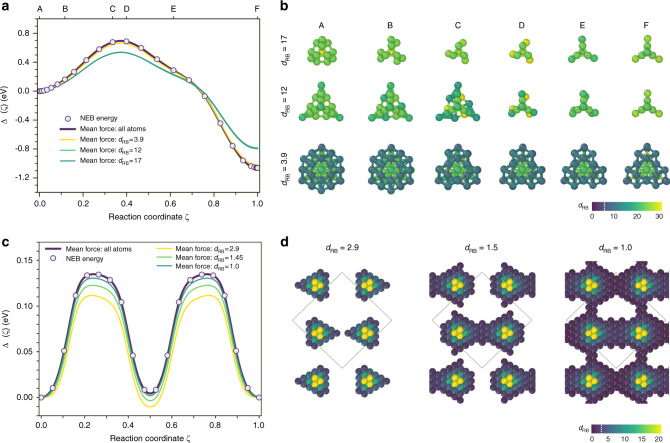
Fig. 5. Reconstruction of defect energy profiles from mean force calculations.
a Energy profile along the SIA transition pathway in bcc Fe. Comparison of the total energy NEB calculations with the mean force integration over the confidence region defined by different distortion score cutoff. The calculations are performed using Marinica EAM potential38,45. b Evolution of the defect structure along the transition path provided by the distortion scores based on the robust MCD analysis. The stratified defect structures are shown for the cutoff distortion scores dRB = 3.9 (full defect cluster), dRB = 12 and dRB = 17. The atoms are coloured according to their distortion scores. The colour code corresponds to the scale bar provided in d. The depicted atomic clusters are oriented along the 〈111〉 direction. c Energy profile of the screw dislocation dipole glide in {110} plane in bcc Fe. Comparison of the total energy NEB calculations with the mean force integration over the confidence region defined by different distortion score cutoffs. The calculations are performed using Ackland-Mendelev EAM potential44. d The stratified structures of the dislocation cores with different distortion score dRB based on the robust MCD analysis. The critical MCD threshold of the bulk structure is dRB = 2.9. The atoms are coloured according to their distortion scores. The depicted structures are oriented along the 〈111〉 direction.

