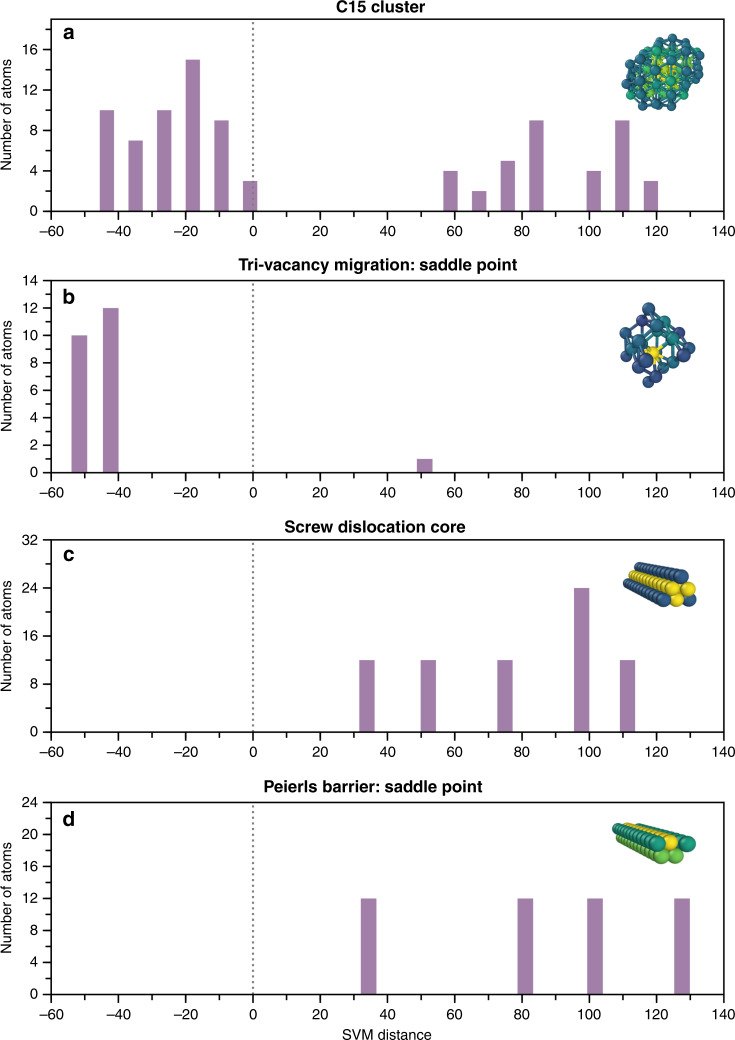
Fig. 7. Qualitative estimation of a kernel potential performance for given defects.
Histogram of the number of atoms vs. the dSVM distance is plotted for the four defects not included in the database of the tested GAP potential50 for bcc Fe, for which: a, b the potential exhibits a limited transferability; c, d the potential performs well. The inset structures from subplots (a–d) illustrate the cores of defects detected using the distortion score for the cluster, the saddle point configuration of tri-vacancy migration, the minimum energy and the saddle point configurations of screw dislocations, respectively. The vertical dotted line indicates the decision boundary between the outliers (negative values) and the inliers (positive values).

