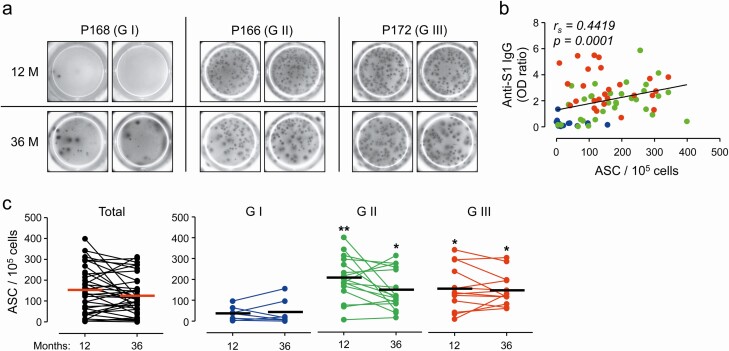
Figure 3.
Quantification of spike-specific memory B cells in peripheral blood mononuclear cells (PBMCs) taken at 12 and 36 months after infection in 36 subjects. A, Representative images of B cell ELISPOT results. B, Correlation of OD ratio values against S1 antigen with anti-S IgG-secreting B cell counts were assessed by linear regression (black line) and Spearman’s rank test (rs and P value). PBMCs were taken at 12 and 36 months after infection from 36 subjects (G-I: n = 7, G-II: n = 16, and G-III: n = 13) and applied for analysis of spike antigen-specific IgG secreting memory B cells. C, Kinetic changes of anti-S IgG-secreting B cells in PBMCs are presented. Statistical analysis was performed using one-way ANOVA, followed by the Newman–Keuls t-test for comparisons of values among the severity groups at the indicated time points. Abbreviation: ASC, antibody-secreting cells; IgG, immunoglobulin G; OD, optical density. *, P < .05; **, P < .01.

