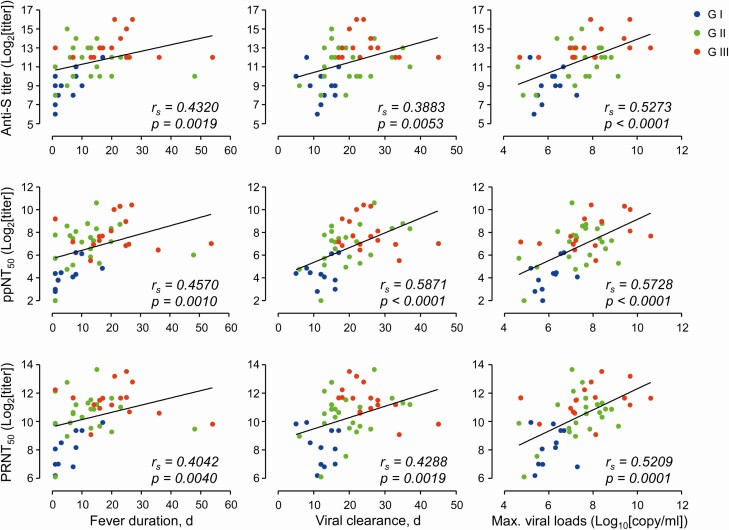
Figure 4.
Correlation of antibody levels with fever duration, viremic period, and maximum viral loads during infection period. Correlations of antibody levels (anti-S IgG titer, ppNT50, and PRNT50 in sera collected at 1 year after infection) with the indicated parameters observed during infection periods in 50 subjects (G-I: n = 11, G-II: n = 23, and G-III: n = 16) were assessed by linear regression (black line) and Spearman’s rank test (rs and P value). Abbreviations: IgG, immunoglobulin G; Max., maximum.

