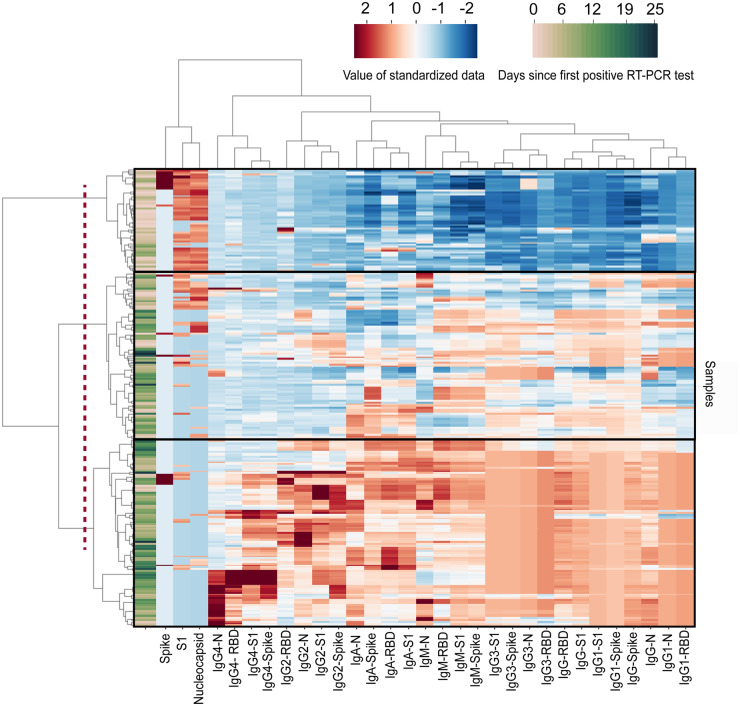
Fig. 3.
Clustergram of Simoa antigen and immunoglobulin results from 252 samples from 39 patients. Cluster map produced by Ward variance minimization algorithm. 252 samples from 39 patients were analyzed as described in the Methods section. Data were standardized after a nonlinear transformation and each row represents a single sample. Days since first RT-PCR test for each sample are presented at the far left of the clustergram. Longitudinal samples are clustered by dendrograms to the left of the clustergram. SARS-CoV-2 antigen and immunoglobulin markers are clustered by dendrograms at the top of the clustergram. The dotted line represents the cutoff that results in 3 branches: branch 1 (top), branch 2 (middle), and branch 3 (bottom). RBD: Receptor binding domain. N: Nucleocapsid.

