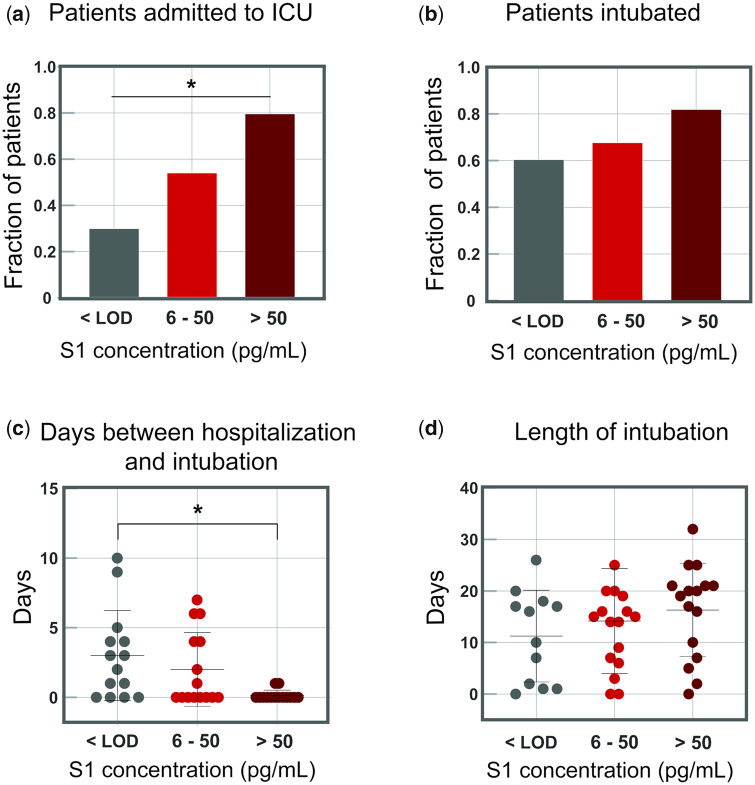
Fig. 5.
Indicators of disease severity based on S1 concentrations in plasma for 64 COVID-19 positive patients. COVID-19 positive patients were separated into 3 groups based on S1 concentrations. The cutoff between groups 2 and 3 (50 pg/mL, 0.65 pmol/L) was chosen as 5 standard deviations above the LOD. The fraction of patients admitted to the ICU or who were intubated was calculated for each group independently. a) Fraction of COVID-19 positive patients who were immediately admitted to the ICU upon presentation to the hospital. b) Fraction of COVID-19 positive patients who were intubated during hospitalization. c) Days between date of presentation to the hospital and intubation date for intubated COVID-19 positive patients. d) The length of intubation for intubated COVID-19 positive patients. For all plots, significance indicated by the asterisks (P < 0.05).

