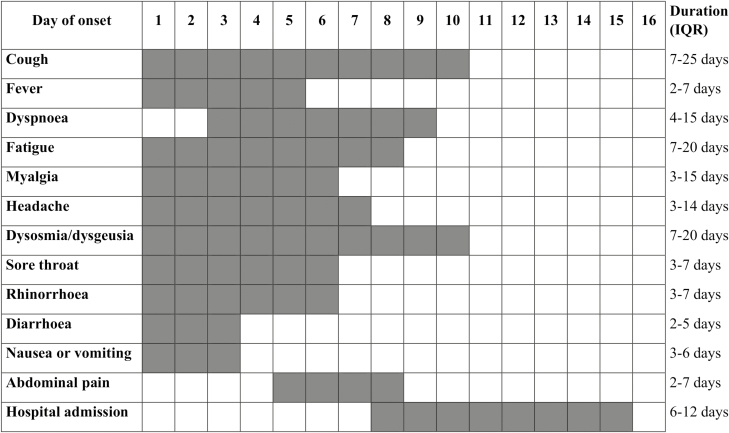
FIGURE 4.
Date of onset and duration of symptoms in IBD patients with confirmed or suspected COVID-19. The first gray square in the left of each row represents the median time of onset of symptoms and the median days since the onset of symptoms to hospital admission. The number of gray squares in each row represents the median duration of symptoms and hospital admission. There were no statistically significant differences between confirmed and suspected COVID-19 patients in any item. Abbreviation: IQR, interquartile range.

