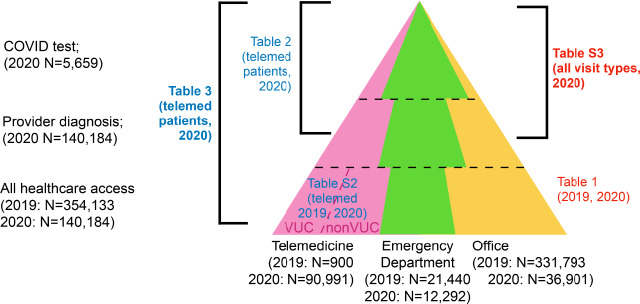
Figure 1.
Overview of places where disparities may manifest through healthcare access, provider diagnoses, and testing process. Sample sizes for each visit type and healthcare process by year are provided. Each analysis and the corresponding Table where results are reported are also indicated. Red font/tables listed on right side used for analyses on data from all patients; blue font/tables on left side represent analyses on telemedicine patients only. Bold font used to indicate regression analyses. Triangle sizes are for illustration only.

