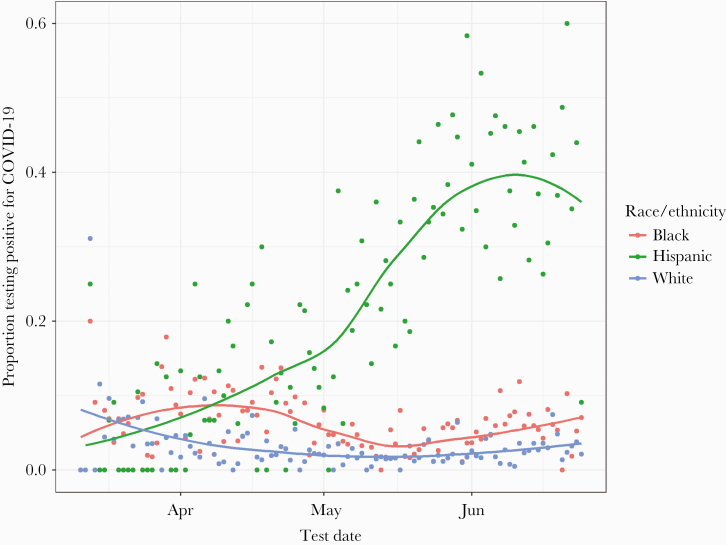
Figure 2.
Temporal trends in coronavirus disease 2019 (COVID-19) positivity by race/ethnicity. Proportion of positive COVID-19 tests over time, stratified by race/ethnicity. For ease of visualization, data are shown only for black, white, and Hispanic groups. Fitted lines represent a locally weighted scatter-plot smoother (LOESS) regression.

