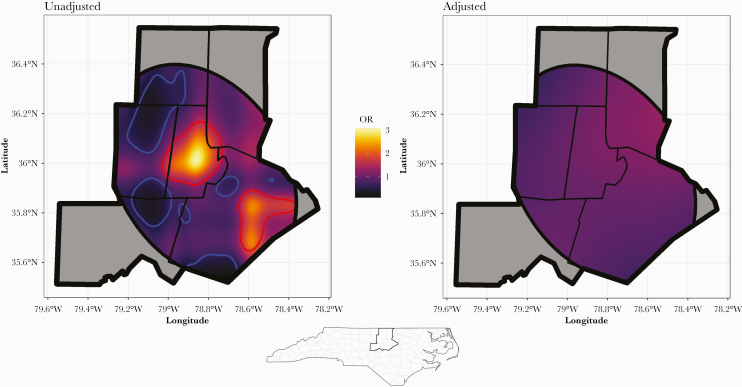
Figure 3.
Spatial distribution of coronavirus disease 2019 testing results. The study area depicted is a 6-county area around Durham, NC. The elliptical shape that intersects the study area was a 2-standard deviational ellipse, the smallest possible ellipse containing 95% of the subject locations. The odds of a positive test were modeled using the home address coordinate locations of individual subjects as a smoothed, 2-dimensional independent variable. These models were then predicted on a dense grid of coordinate pairs covering the study area. The local odds ratio (OR), depicted in the color background, was computed by dividing the odds at each coordinate pair in the prediction grid by the average odds. Areas circumscribed by high (red) or low (blue) contours are those in which the local OR has at least a 95% probability of differing from the average. Areas with the highest OR in our unadjusted model included the cities of Durham and Raleigh. Adjusting for individual and neighborhood variables eliminated much of the geographic heterogeneity in OR.

