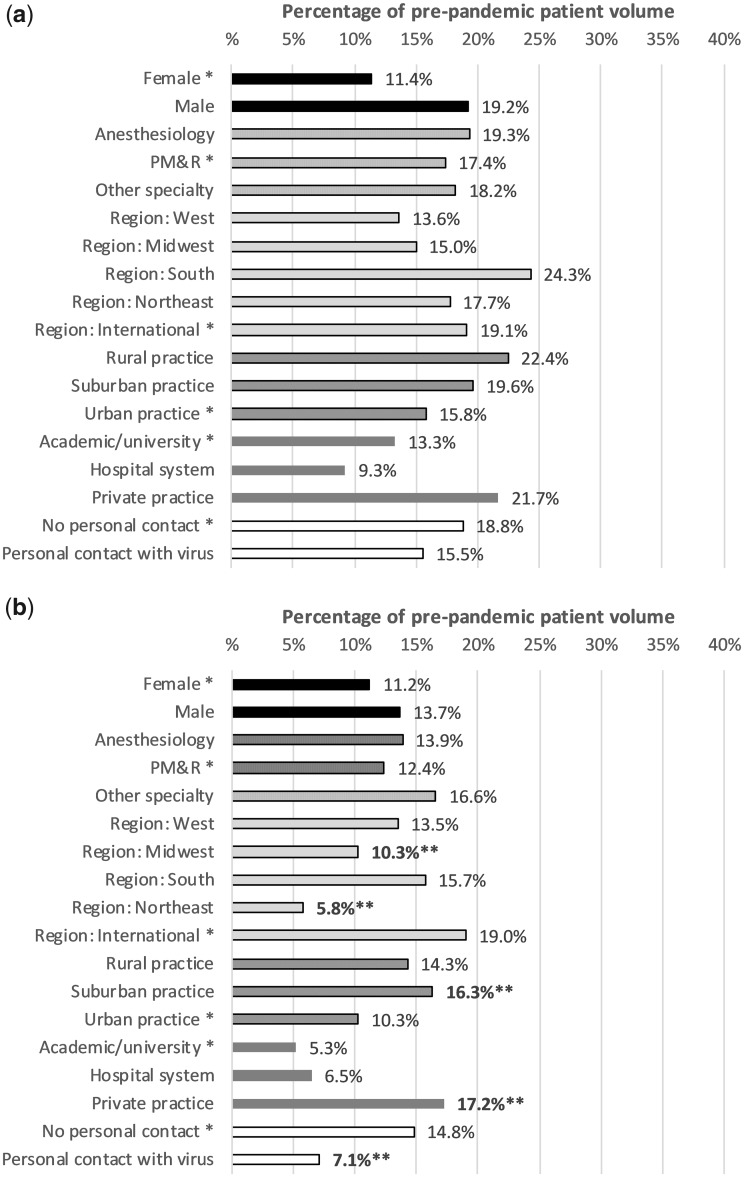
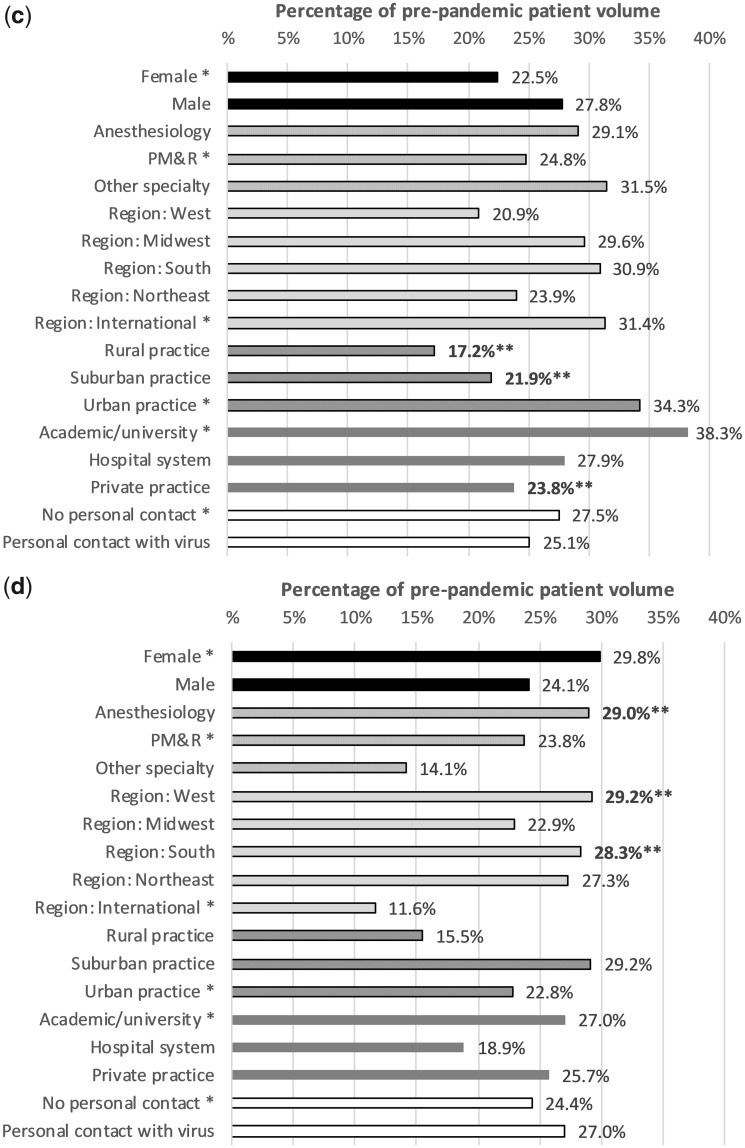
Figure 4.
Clinical volumes, compared with prepandemic patient volume. For example, 20% would mean that the subgroup is seeing 20% of their typical total patient volume compared with their prepandemic baseline. If a practitioner was seeing 100 patients in clinic before the pandemic, then 20% would refer to 20 weekly patients in the clinic after the pandemic practice changes. If a practitioner was performing 100 procedures weekly, 20% would refer to 20 weekly procedures after the pandemic practice changes. a) In-person clinic visits. b) Procedural volume. c) Telephone visits. d) Telemedicine (video) visits. *Reference group for statistical comparisons. **Statistically significant difference compared with the reference group.


