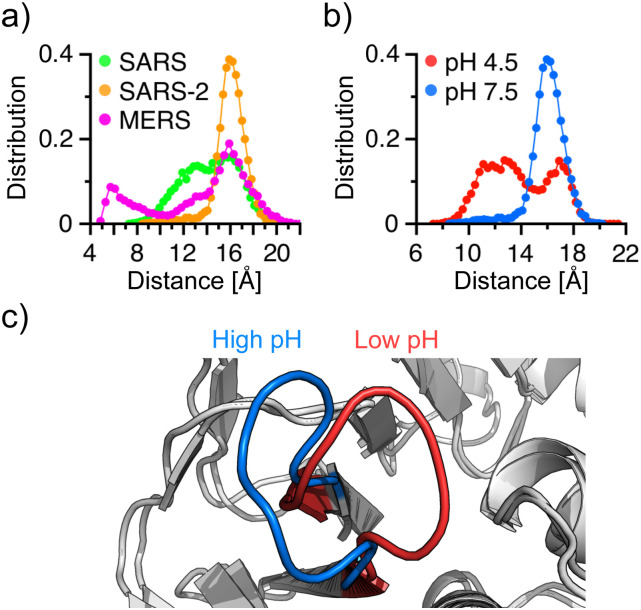
FIG. 5.
Comparison of the BL2 loop conformation across the three PLpros and between low and high pH. (a) Probability distributions of the Cα distance between Tyr269/268 and Asp165/164 in SARS-CoV/CoV-2, and between Thr274 and Asp164 in MERS-CoV PLpro at pH 7.5. (b) Probability distribution of the Cα distance between Tyr268 and Asp164 in SARS-CoV-2 PLpro at pH 4.5 (red) and 7.5 (blue). (c) Overlaid crystal structures showing the closed (red; pH 4.5 structure) and open (blue; pH 7.5 structure) BL2 conformations.

