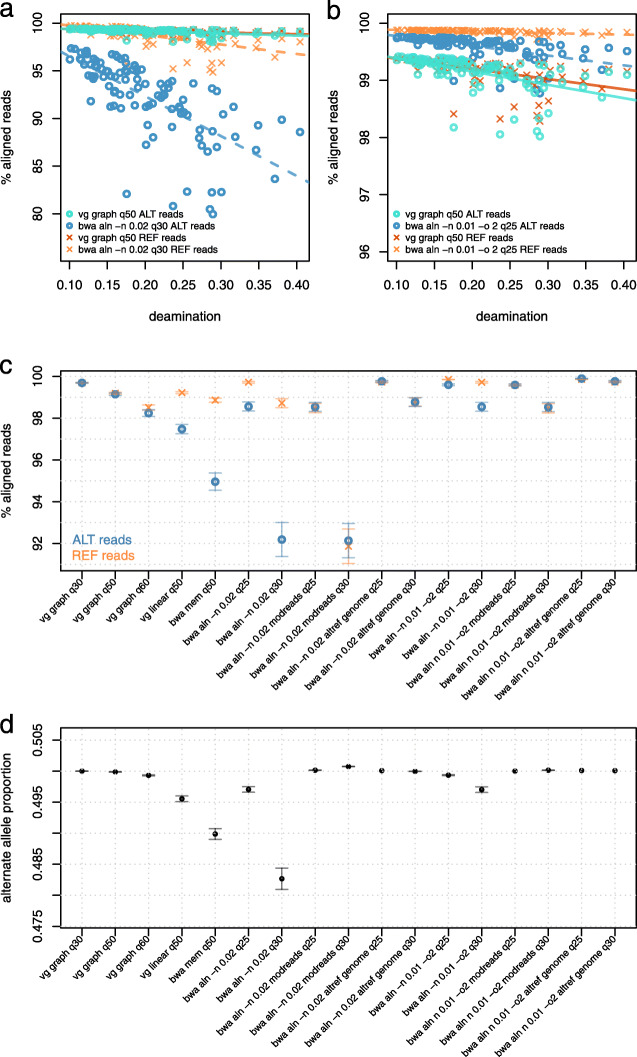
Fig. 2.
Comparing vg graph, bwa aln, and bwa mem using simulated ancient DNA. Comparing bwa aln and vg map performance when aligning reads simulated from chromosome 11 of the Human Origins panel. Lines represent ordinary least squares (OLS) regression results for the allele/aligner conditions corresponding to their colors. a Comparison between vg graph and bwa aln -n 0.02. b Comparison between vg graph and bwa aln -n 0.01 -o 2. c Comparison of the mean percentage (and 95% CI) of mapped reads in simulated data by vg graph, bwa aln, and bwa mem using different alignment parameters and minimum mapping quality filtering thresholds. d Mean alternate allele fraction (and 95% CI) of simulated reads after alignment with the different methods and minimum mapping quality filtering thresholds. We also show results obtained after processing simulated data with two previously published workflows for addressing reference bias: modified reads (“modreads”) [10] and modified reference genome (“altref genome”) [15]

