Fig. 1.
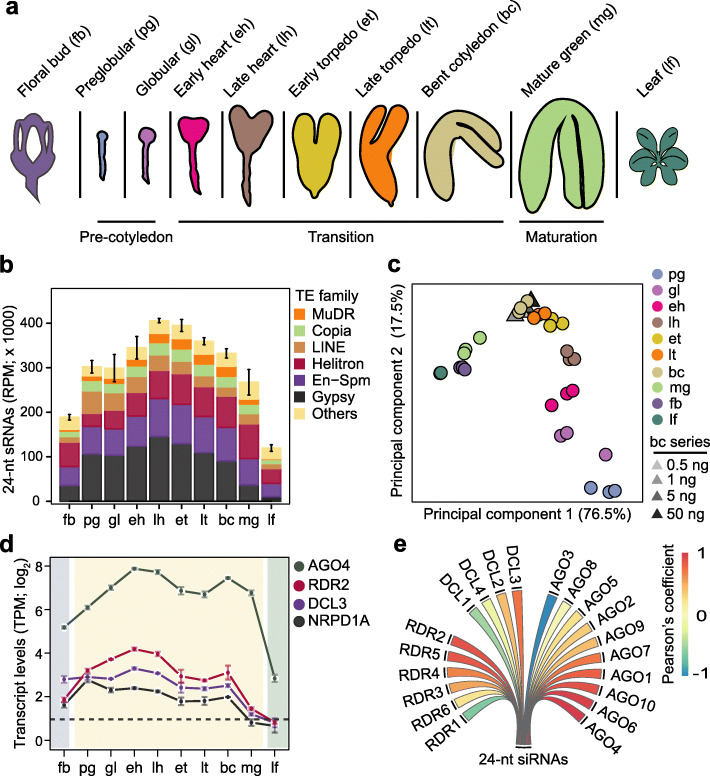
Embryos are enriched for transposon-derived small RNAs. a Schematic of embryonic stages and tissues previously used for small RNA profiling [39] and analyzed in this study. b Stacked bar chart representing the abundance of 24-nt sRNAs from various TE families in floral buds, embryos, and leaves (key). Error bars indicate standard error of mean TE-derived 24-nt siRNA levels from three biological replicates. RPM, sRNA-seq reads per million genome-matching reads. c Principal component analysis of 24-nt sRNAs mapping to TEs in floral buds, embryos, leaves, and a dilution series of RNA isolated from bent cotyledon stage embryos (key). d Line chart illustrating transcript levels of 24-nt siRNA biogenesis factors in embryonic and post-embryonic tissues based on mRNA-seq [40]. Error bars represent standard error of mean transcripts from three biological replicates. TPM, transcripts per million. e Pearson’s correlation coefficients between means of TE-derived 24-nt siRNAs and DCL, RDR, and AGO transcript levels in floral buds, embryos, and leaves. Pearson’s correlation coefficient values are represented according to the key. See also Additional file 2: Figure S1

