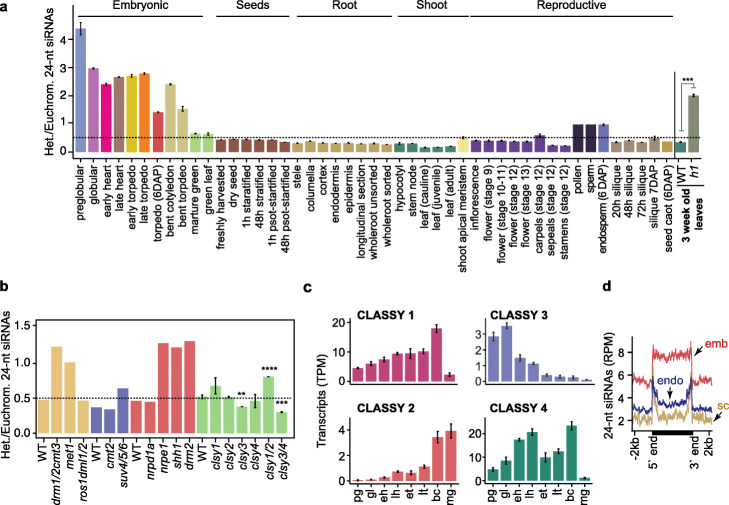
Fig. 6.
Homeostasis of transposon-derived siRNAs. a Bar chart illustrating the relative enrichment of length-normalized 24-nt siRNAs derived from heterochromatic relative to euchromatic TEs across development, and in h1 mutant leaves. P values < 0.001 based on Student’s t test of heterochromatic vs euchromatic 24-nt siRNA enrichment differences between wild-type and h1 tissues are represented by ***. Various tissues and cell-types from different phases of the plant life-cycle are labeled and include those from published datasets [29, 39, 65–68]. b Relative enrichments of 24-nt siRNAs derived from heterochromatic relative to euchromatic TEs in RdDM and related mutants. Wild type (WT), drm1/2 cmt3, met1, and ros1 dml1/2 [69]; WT, cmt2, and suv4/5/6 [43]; WT, nrpd1a, nrpe1, shh1, and drm2 [21]; WT, clsy1, clsy2, clsy3, clsy4, clsy1/2, and clsy3/4 [19]. P values < 0.0001, < 0.001, and < 0.01 based on Student’s t test of heterochromatic vs euchromatic 24-nt siRNA enrichment differences between wild-type and mutants are represented by ****, ***, and **. c CLASSY1, CLASSY2, CLASSY3, and CLASSY4 transcript levels (TPM) during embryogenesis. d Metaplots of 24-nt siRNA levels overlapping long heterochromatic TEs in 6 DAP embryo (red; emb), endosperm (blue; endo), or seed coat (yellow; sc) tissues based on [65]. See also Additional file 2: Figure S6

