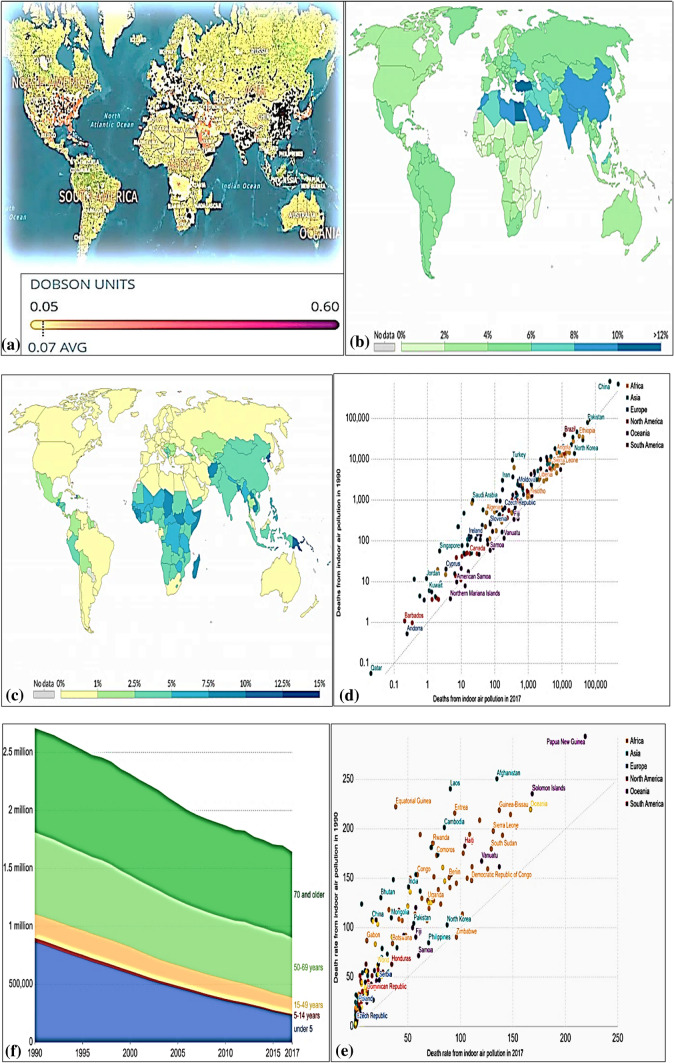
Fig. 3.
Status of air pollution mediated death in world. a Footage given by the European Space Agency indicates that Nitrogen Dioxide (NO2) pollution is predominant in the global troposphere, i.e. the lowest (and largest) layer of the Earth’s atmosphere that ranges from ground level to 10 km upwards. The darker or pinker cloud indicates the higher level of NO2 (Dobson units) in an area. The black dots shows the highly NO2 polluted area. Data are generated by the new Sentinel 5P satellite of the European Space Agency from an average values measured daily for 90 days, i.e. from June to August 2018 (Source Chow 2020; Environmental Protection Agency, 2020, Myllyvirta and Howard 2020). b Colour intensity showing global death rate by air pollution. Percentage shows the death rate by air pollution as compared to other diseases (Source Institute for Health Metrics and Evaluation 2020), c Indoor and outdoor air pollution mediated death in world. A colour intensity of air pollution showing global death rate by indoor air pollution. Percentage shows the death rate by indoor air pollution as compared to other diseases, d Number of deaths by indoor air pollution in 1990 versus 2017, e Indoor air pollution death as a function of age. Old age people above 69 year are more prone for indoor air pollution risk, f Indoor air pollution rate per 100,000 people in 1990 versus 2017 in country wise distribution. Raising indoor air pollution makes a concern globally (Source Institute for Health Metrics and Evaluation 2020 under creative common license attribution)

