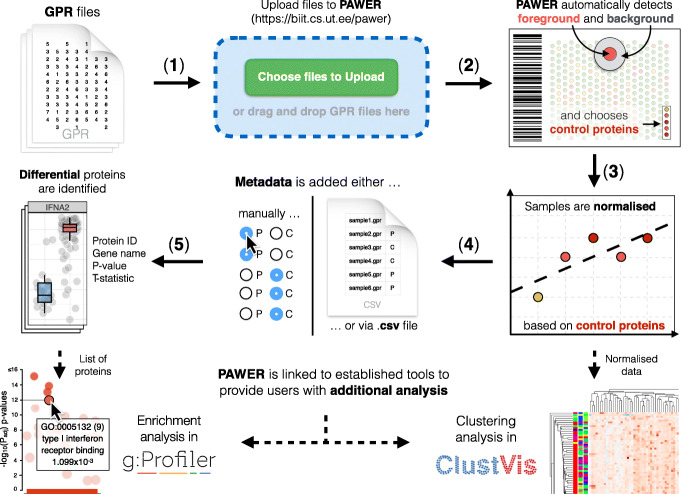
Fig. 1.
PAWER pipeline. Raw GPR files are uploaded to PAWER (1), then the system proceeds to identifying foreground and background intensities and a panel of control proteins that can be used for normalisation (2). Robust linear model is then used to estimate and remove the technical artifacts associated with each array and array block (3). Normalised data is then combined with sample metadata (4) to produce a list of differentially expressed proteins (5). PAWER is linked with two other tools (g:Profiler and ClustVis) to enable additional analysis, namely: protein enrichment analysis. The figure was generated in Keynote, version 10.1 (6913)

